
IoT Infrastructure: Design and Implementation
IoT Design Goals
When designing a data pipeline for transmission between cloud and local single-board computers, I was handed the following goals:
- Low data usage: Stations use data plans. I aimed to keep it under
1GB/month, but the result was much lower - Reliable real-time updates: I shrink packets and make sure re-uploads are attempted when the network is not entirely down. Network switching is handled on the hardware level when one LTE network is down.
- High resolution & Low resolution: Certain data is required to be uploaded immediately. Such data may have a lower resolution requirement (
3sinterval compared to1sinterval). On the other hand, when debugging a particular issue to review system performance, we may prefer the highest resolution data. We require the issuing of debugging mode for any components over the cloud. - Redundancy: If the pipeline fails for any reason, there needs to be a backup solution for data collection and processing
- Alerts: Any condition or data change from sensors or components can trigger an alert. This should be easily configurable. Cloud lambda is also required to handle alert notifications.
- Data Storage: Alerts and component data need to be stored somewhere where the latest information is cached. Multiple levels of backups exist for database storage and raw logs from components.
- Cloud Streaming: Data needs to be streamed to the frontend in real-time. Historical data and metrics can be fetched from endpoints.
- Postprocessing and Formatting: Standards are created so that the configuration of new components is straightforward. This includes the creation of database records, backup methods, postprocessing rules, alert rules, and notification settings.
- Command Issuing: Like RPCs, users should be able to issue any commands given permission to a group of systems or components through the cloud. This makes the request and response bidirectional. Users can include arbitrary data inside the command payload and systems return response in real-time. This is also stored as time series data.
- VNC on Web: Authorized users can view the real-time screen on the charging station directly on the website. VNC data and buffer are proxied using our cloud services.
- Local Protocol Forwarding: Protocols like Modbus implemented on certain components may only support a single reader. Local software is implemented to forward such data reliably to local consumers in real-time.
- Local Version Management: Authorized users can perform system maintenance (e.g., configure system and components, local software logs, local software upgrade/downgrade) directly on the web. I decided to implement using
Docker socketand proxy user requests through the cloud, and then as local commands. This custom implementation follows a Docker management service model like Portainer but is optimized for IoT devices. This allows us to configure multiple services as containers on different devices inside LAN and be accessed by one producer container for container management.
This article mainly focuses on IoT and data pipelines, the implementation and configuration of remaining cloud services are covered here:
Local Data Pipeline
Most of our local components provide Modbus servers for data scraping. They follow a register-based approach where each data segment has its bits and data type.
Generic Parsers & Scheduler
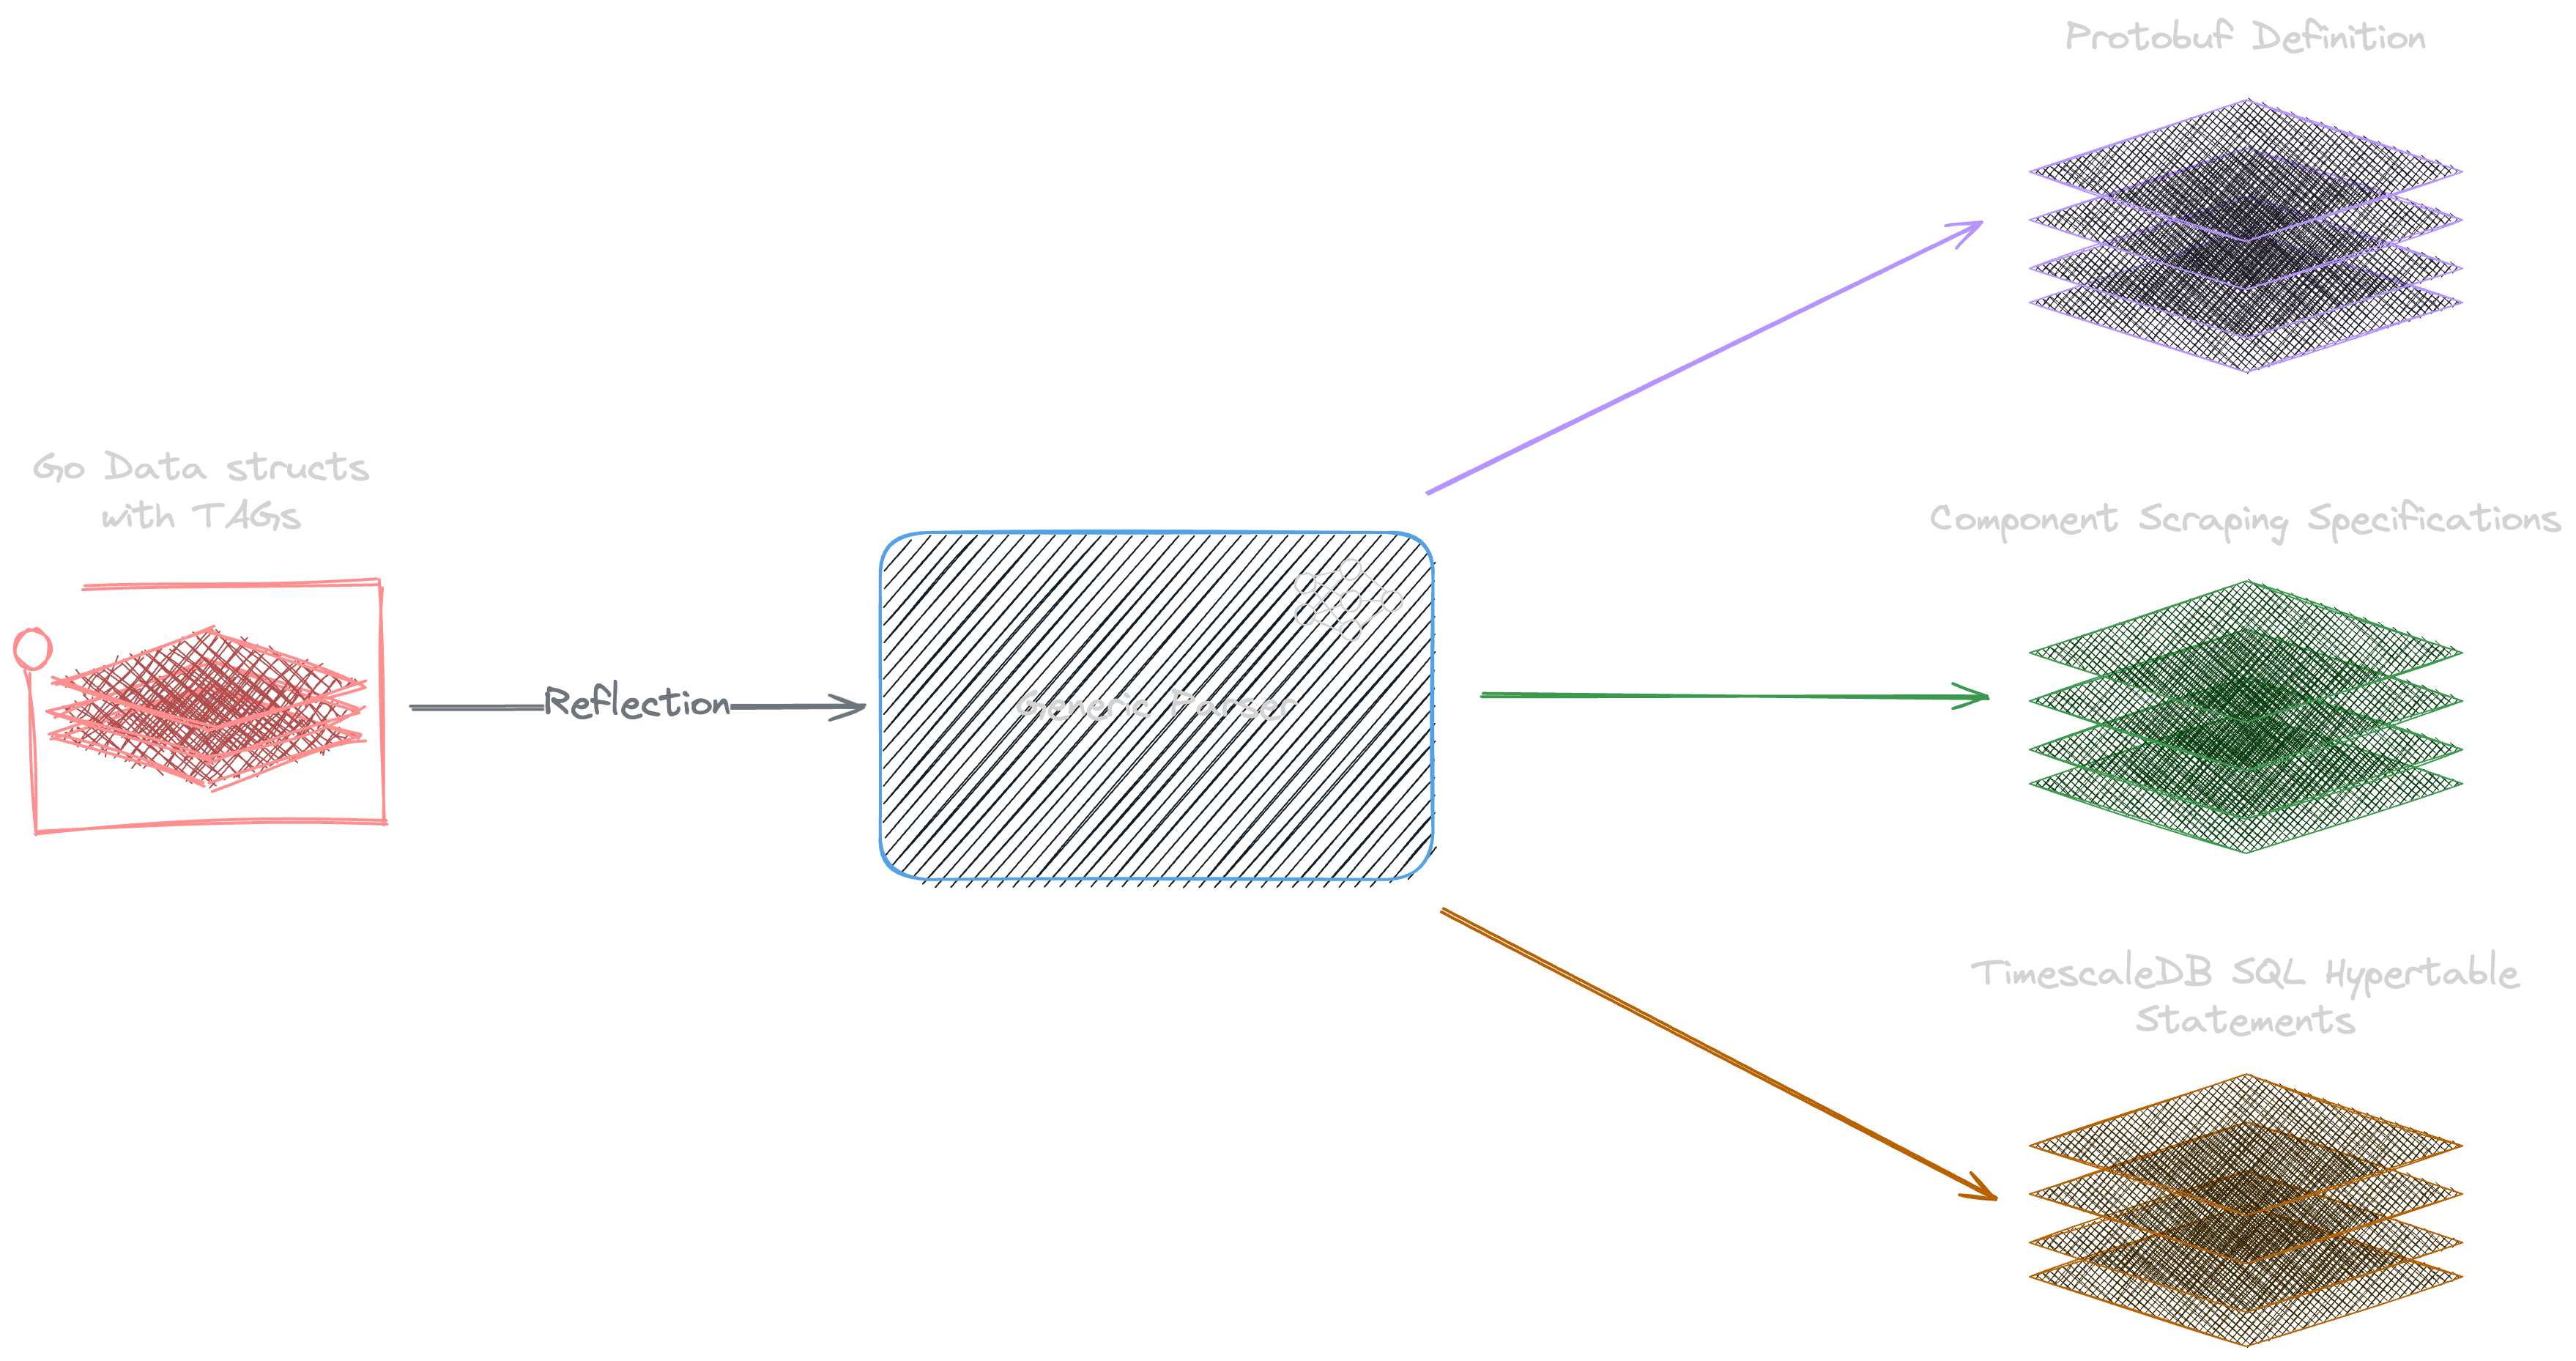
I implemented a custom parser and goroutines for collection using go tags. Here's an example struct for a component ESS with specification formats generated from the parser:
type ESS struct {
	CellVoltage int16 `start:"140" every:"aws-15,local-1" scale:"0.1" device:"ESS"`
	SysTemp int16 `scale:"0.1"`
	SysHumidity int16
	ESSState `onChange:"aws,local"`
}

type PublishSpec struct {
	Intervals      map[Destination]time.Duration `json:"intervals,omitempty"`
	DebugIntervals map[Destination]time.Duration `json:"debugIntervals,omitempty"`
	OnChange       []Destination                 `json:"onChange,omitempty"`
	DebugOnChange  []Destination                 `json:"debugOnChange,omitempty"`
}
type PublicSpec struct {
	Type     string           `json:"type,omitempty"`
	Scale    *decimal.Decimal `json:"scale,omitempty"`
	Offset   *decimal.Decimal `json:"offset,omitempty"`
	Register *int             `json:"register,omitempty"`
}
type FieldSpec struct {
	PublishSpec
	PublicSpec
	GroupName  GroupName `json:",omitempty"`
	Identifier string    `json:",omitempty"`
	Name       FieldName `json:"-"`
}
How tags work with parsers:
- AST Scanning: I used Go's
AST (Abstract Syntax Trees)andreflectto parse and scan all structs along with tags attached to their fields. - Protobuf Generation: Protobuf provides faster serialization and deserialization and a smaller size. I generate Protobuf definitions from all our data segment structs.
I found that data generated using Protobuf is only around 10% smaller compared to Json when we batch and compress data.
- Dynamic Specification: Parsers generate a local data structure representing components specification with their registers and configuration using these tags (See below for tags parsing).
- Components: A local configuration file is loaded in to see which components should be fetched and from where (e.g., IP/Port or device path). They are used together to create scheduled goroutines to scrape data from corresponding components:
{
  "tcpDevices": [
    "ip": "LAN_IP",
    "port": "9002",
    "device": "ESS"
  ],
  "rtuDevices": []
}
Tags:
| Tag | What it does | Data Type | Carries forward to following fields |
|---|---|---|---|
| start | start register for modbus | INT | no |
| scale | apply a scale in preprocessor | FLOAT | no |
| offset | add a number in preprocessor | FLOAT | no |
| onChange | report to a certain destination when data changes | destination ids, separated by comma | yes |
| debugOnChange | same as above, except only report when debug mode is on | yes | |
| every | report to a certain destination on tick interval | destination ids, followed by tick interval in seconds separated by comma | yes |
| debugEvery | same as above, except only report when debug mode is on | yes | |
| device | device group this data segment belongs to | STRING | yes |
| identifier | group identifier used in postprocessor | STRING | yes |
| group | additional groups this data segment belongs to | STRING, separated by comma | yes |
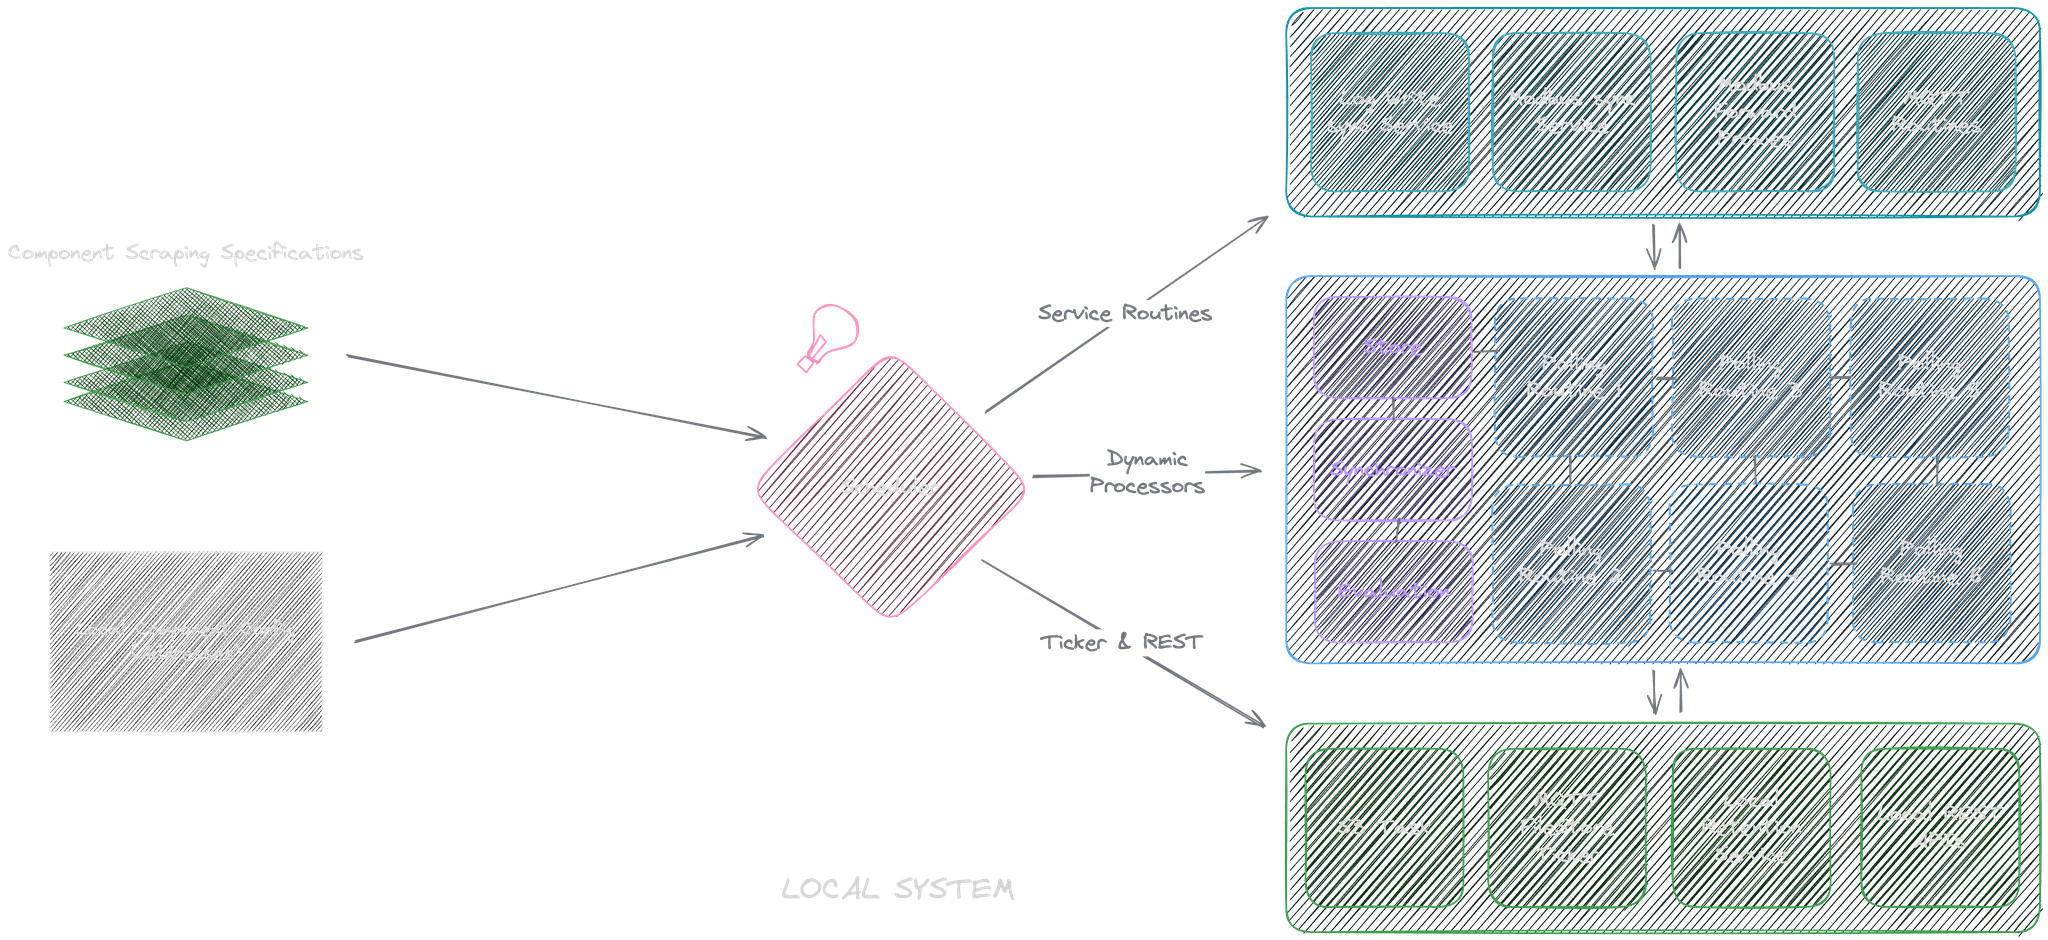
Tasks are scheduled based on tick interval of either the specified min every interval or the base tick interval allowed by the modbus server. After this, a preprocessor runs to fetch data based on the struct size from the modbus server, compares its data between each run, filters data, batches data, and reports to destinations.

Dynamic Processors
One reason registers and devices are defined by structs is that it allows us to attach post- and pre-processing functions directly to the struct:
type Base struct {
}
// Base implements DataStruct with default functions
type DataStruct interface {
    // DataStruct: a pointer to the struct which contains latest register data (e.g., ESS)
    // DataSpec: a data structure that contains all the tag specifications of this piece of data segments
    // DeviceConfig: the local configuration of this device
	 preProcess(dataStruct DataStruct, spec DataSpec, deviceConfig config.DeviceConfig, destination Destination, client modbus.Client) bool
    // Destination: The destination to report to
    postProcess(dataStruct DataStruct, spec DataSpec, deviceConfig config.DeviceConfig, client modbus.Client)
    alertsGen(dataStruct DataStruct, spec DataSpec, deviceConfig config.DeviceConfig, currentAlerts AlertMap) AlertMap
}
type ESS struct {
    ...
    Base
}preProcess(): This function allows us to preprocess field values before reporting to the destination. Returntrueto report and returnfalseto block this reportpostProcess(): Procedures to run after reporting is donealertsGen(): Returns new alerts to generate and alerts to clear, this will be processed and reported by our generic parser
Since every data segment implements DataStruct, schedulers can safely invoke their corresponding processors before executing its tasks.
Modbus Read and Write
Modbus only allows n bits read or write at a time. Our modbus.Client implements functions to safely break up large reads or writes based on preconfigured max values and assembles them based on the ByteOrder and WordOrder to and from bytes/structs.
This means, in any dynamic processing process, developers can safely write structs to or read structs directly from Modbus servers.
Read and Write synchronization with channels
Instead of calling and interacting with clients directly, I created specific goroutines on initial action calls (e.g., Modbus Read). These actions are only wrapped in chan and passed to corresponding services to avoid concurrent operation on a single client.
func (action *modbusActionWithToken) handle(handler config.ModbusHandler, client wmodbus.Client, deviceConfig config.DeviceConfig) {
	// defer closing the complete channel to signal that the action is complete and log that the action is complete
	defer func() {
		select {
		case <-action.complete:
			// If the channel has already been closed, this case will be executed
		default:
			close(action.complete)
		}
	}()
	var err error
	// this is tied to client and only connects if connection is nil
	err := handler.Connect()
	if err != nil {
		log.Warnf("Failed to connect to: %s, Error: %s", deviceConfig.GetIdentifier(), err)
		updateConnectionStatus(deviceConfig, false)
		return
	} else {
		updateConnectionStatus(deviceConfig, true)
	}
	// if the action callback is not nil, call it
	if action.Callback != nil {
		action.Callback(client, handler)
	}

	// if the action should close after, close the connection
	if action.CloseAfter {
		err = handler.Close()
		if err != nil {
			logger.Errorf("Failed to close connection to: %s, Error: %s", deviceConfig.GetIdentifier(), err)
		}
	}
}

func updateConnectionStatus(deviceConfig config.DeviceConfig, connected bool) {
	// create a unique identifier for the device config and group name
	identifier := deviceConfig.GetIdentifier() + ";" + deviceConfig.GetGroupName()
	// get the group name
	group := deviceConfig.GetGroupName()
	// lock the connections map for reading and get the connection status for the identifier if it exists
	ModbusConnectionsMutex.RLock()
	status, ok := ModbusConnections[identifier]
	ModbusConnectionsMutex.RUnlock()
	statusChanged := false
	// if the status doesn't exist, create a new one and add it to the map
	if !ok {
		status = &ConnectionStatus{
			Connected: connected,
			Time:      time.Now().Unix(),
			Group:     group,
		}
		ModbusConnectionsMutex.Lock()
		ModbusConnections[identifier] = status
		ModbusConnectionsMutex.Unlock()
		statusChanged = true
	} else if status.Connected != connected { // if the status exists and the connected flag is different, update the status
		status.Connected = connected
		status.Time = time.Now().Unix()
		statusChanged = true
	}
	// if the status changed and the application type is a device, report the status to the cloud via mqtt with locking
	if statusChanged {
		log.Warn("Device connection status changed: ", identifier)
		statusBytes, err := json.Marshal(status)
		if err != nil {
			log.Error("Failed to marshal status: ", err)
			return
		}
		// report the status to the cloud via mqtt with locking and the identifier as the key
		mqtt.ReportWithLocking("ModbusStatus", map[string]interface{}{
			identifier: string(statusBytes),
		})
	}
}It's possible for a local component to fault and close the Modbus Server. This may happen without issuing any signals. We maintain a map of component connection status on the cloud.
Modbus Forwarding:
This is handled by attaching a forward config to the local configuration file.
- Our handlers first create a Modbus server under the IP/Port
- It uses our Specifications parsed from tags to check the register range and read them based on the intervals
- These registers are forwarded and written to the forward server
- This server is used by our schedulers
When a write register command comes in, our forwarder forwards it to the original server and returns the response from the original server.
This allows our single connection Modbus servers to be proxied and used by multiple local services
"forward": {
   "ip": "localhost",
   "port": "9001",
}
Destinations
I implemented three default destinations with their rules and their own maintenance schedulers:
- MQTT: Data is published to MQTT under the topic of the system and group, and compression is used to batch our real-time data. Data is unpacked on the subscriber side
- Local: Data is recorded to local
CSVlogs files with preconfigured retention time - S3: Data is also recorded to local
CSVlogs, but is compressed and uploaded to S3 storage at preconfigured time (e.g., at midnight)
MQTT FileStore:
To avoid network failure and data loss, I initially thought to store failed publish records in memory and retry when the internet is back. However, this had a few issues:
- Producer crash: Even though this hasn't happened, our schedulers may crash and be restarted automatically; we'd lose all data if the internet happens to be down in this case.
- Debugging restarts: In a debugging setting, hardware engineers may restart SBCs, I want to make sure data is not lost in this case.
Our goroutines pass failed publishes to a channel, so it can be written to a local file based on the group this data segment belongs to. On startup and network recovery, it checks any leftover data and republishes it.
go func() {
	for msg := range MessageToWrite {
		err := msg.handle()
		if err != nil {
			logger := fileServiceLogger.WithField("GroupName", msg.GroupName)
			logger.Error(err)
		}
	}
}()
Raw Logs:
In addition to MQTT file store, if a data segment is specified to be reported to S3 or Local, our schedulers write data logs for these groups. All such logs have a date associated with the file and are either uploaded, kept, or deleted based on the configuration.
Using bz2, I was able to keep the data size for all raw logs under 500KB/day, which contained over 70k records. This made sure we had the raw logs on a day-to-day basis while keeping data usage extremely low.

Cloud Data Pipeline
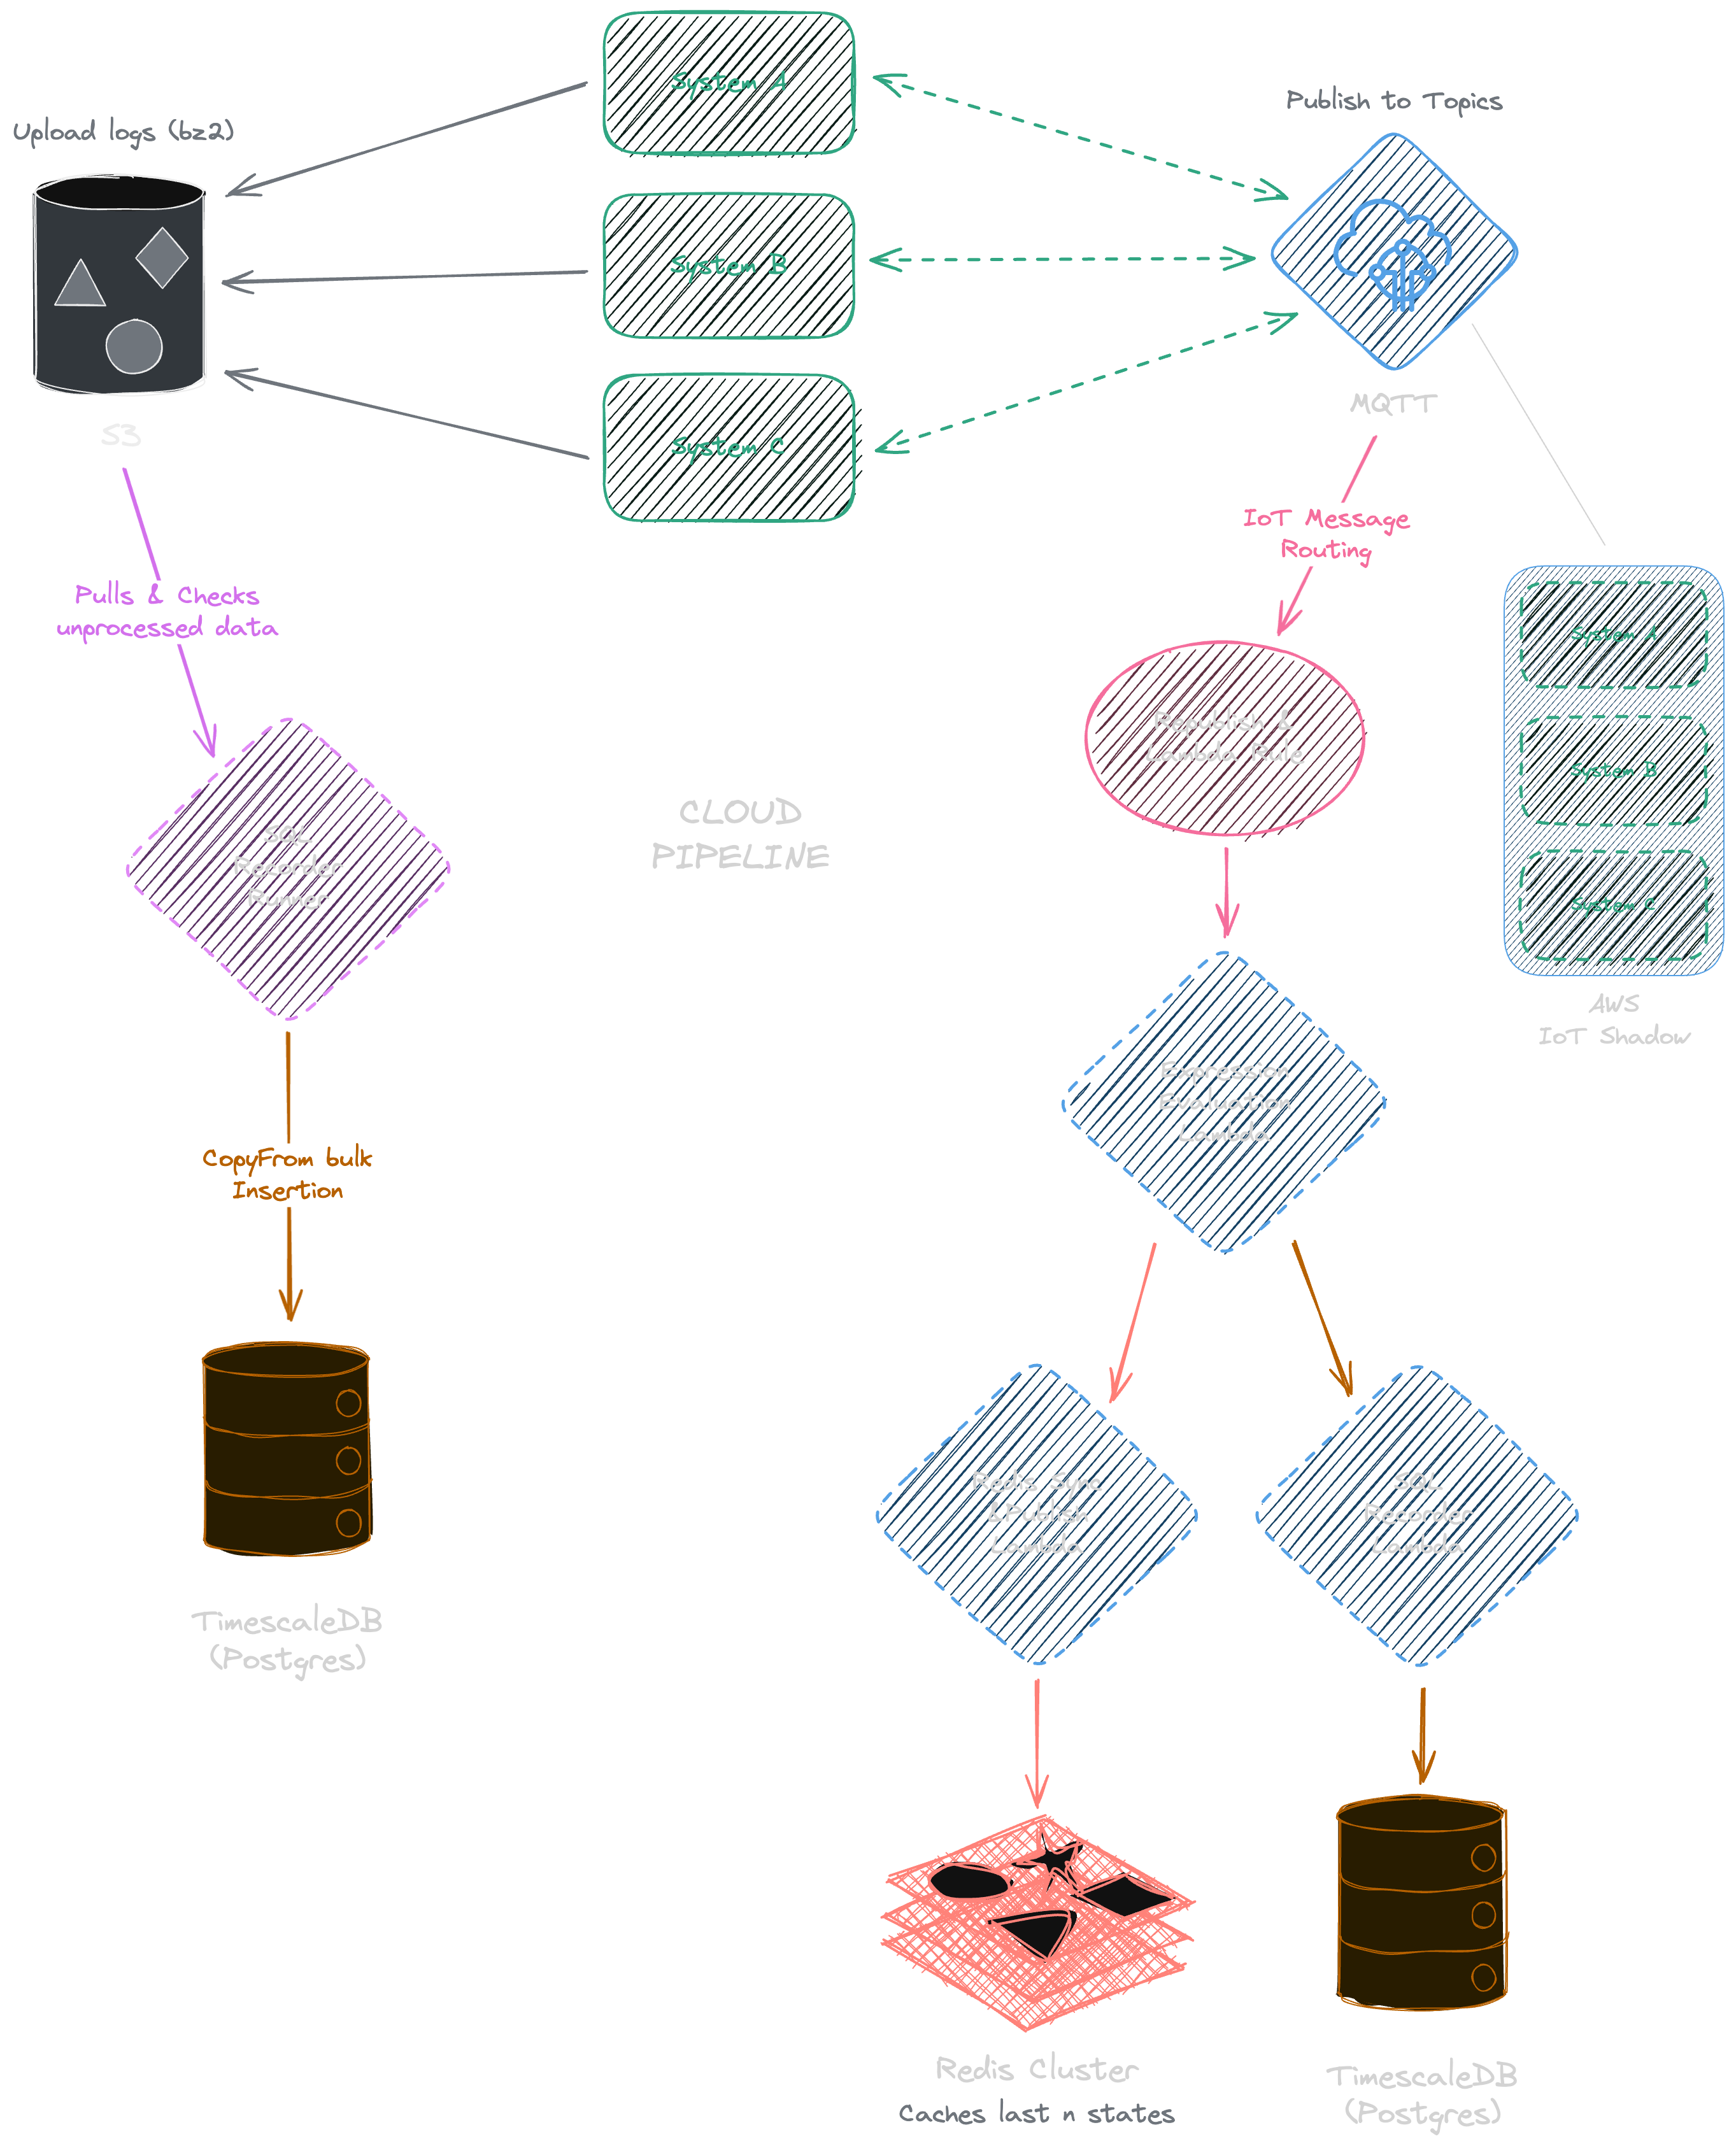
When cloud subscribers receive data from either MQTT or S3, they need to unpack and stream it to cloud storage or caching systems. I decided to use TimescaleDB as it natively uses Postgres and is optimized for large time series data (e.g., compression based on time key, retention, faster metrics computation).
MQTT → AWS IoT Shadow (Layer 1)
We need somewhere to store the latest component states and desired states.
This could be implemented using a caching system and permanent storage with services to store, sync, and retrieve data.
Since we’re already using AWS, we decided to try their [IoT Shadow](AWS IoT shadow provides a complete package).
It meets our needs.
We don't need a lambda to insert into shadow as we publish using AWS topics, which already handles synchronization of shadow using published data from our local data pipeline.
MQTT → Redis (Layer 2)
We could retrieve our device states and sensor data using AWS IoT Shadow:
- By publishing and subscribing to and from
AWS Thingtopic - By
AWS RESTendpoints
I found this approach a bit cumbersome. To avoid tight coupling, I decided to create a second cache in our Redis cluster, which is directly accessible and manageable by our team members. This enables faster loading and frequent requests from our internal microservices to sync system states and store metadata.
I used a Redis Mutex implementation to lock the specific group whenever data comes in and populate its current states while updating its previous state:
- All states are stored as both
KVandJSON, backend developers are free to use either format - We store indices of devices, groups, systems, and sensor identifiers so that developers have quick access to the mapping of an entire system or infrastructure
- We store the
DataStruct Specificationgenerated by ourGo ASTin the redis as well in case developers need to stream it to frontend applications (e.g., hardware engineers may request to update scraping specification used by our Go generic schedulers)
MQTT triggers Lambda publish, and data can be extracted using AWS lambda syntax:
SELECT *, topic(3) as system_name, topic(6) as device FROM '$aws/things/+/shadow/name/+/update/documents'Any deletion from MQTT topic (with a delete identifier) is also streamed to Redis (I only lock the specific group that contains all states if new data has a newer timestamp):
PayloadIn struct {
		Previous  StateAndMetadata `json:"previous"`
		Current   StateAndMetadata `json:"current"`
		Timestamp int              `json:"timestamp"`
		PayloadId

		Params    DynamicMap `json:"-"`
		Evaluated DynamicMap `json:"-"`
		SystemId  *int       `json:"-"`
}
func syncRedisDelete(in shadow.PayloadIn) error {
    _, err := redismgr.Client.Pipelined(ctx, func(rdb redis.Pipeliner) error {
    		rdb.Del(ctx, in.GetRedisStateKey())
    		rdb.Del(ctx, in.GetRedisMetadataKey())
    		rdb.Del(ctx, in.GetRedisRawKey())
    		rdb.Del(ctx, in.GetRedisJsonKey())
    		rdb.HDel(ctx, in.GetRedisGroupsKey(), in.GroupName)
    		deleteEvent := in.GenerateMapOutput()
    		deletedJson, err := json.Marshal(deleteEvent)
    		return nil
    	})
}
By using govaluate, I created an additional postprocessing process on this lambda for Redis. Expressions containing specific groups from our local pipelines are used to further format our data for backend developers.
Example with additional field SomePower using different components, expressions are stored outside code:
var SomePower = shadow.NewExpressionWithField("[Component1.WTot] - [Component2.WTot]", "SomePower")Our lambda retrieves all required fields and evaluates all expressions, and then inserts additional fields back to redis.
MQTT -> Redis Publish
While MQTT publish contains real-time data, we didn't have a corresponding way in Redis to subscribe to it. We didn't want all our backend services to connect to MQTT, so I streamed using Redis again:
- iot:deleted: A JSON containing all fields that are deleted, including their original values under a component and system group
- iot:changed: A JSON containing all fields that have changed under a component and system group
- iot:raw: A JSON representation of the raw component state under the system group
This is handled by a cloud lambda.
MQTT -> Time-Series Database
To initialize the database table along with its retention policies and compression policies, I used AST again to directly generate table SQL from our DataStruct as it contains every piece of information we need.
Example SQL generated by our parser:
CREATE TABLE IF NOT EXISTS ESS (timestamp TIMESTAMPTZ NOT NULL, system_id INT NOT NULL, name TEXT, sys_temp NUMERIC, sys_humidity NUMERIC, ess_state NUMERIC, source SOURCE NOT NULL);
SELECT public.create_hypertable('ESS', 'timestamp', if_not_exists => TRUE);
-- TimescaleDB's enhanced hypertable for time series data

CREATE INDEX IF NOT EXISTS ESS_idx ON ESS (timestamp, system_id);
ALTER TABLE ESS SET (
                timescaledb.compress,
                timescaledb.compress_segmentby = 'system_id'
        );
SELECT public.add_compression_policy('ESS', INTERVAL '7 days', if_not_exists => TRUE);
-- Data that is 7 days old is compressed by timescale db
Another AWS lambda is created to validate, insert, and update data from MQTT to our database.
S3 -> Time-Series Database
Similarly, we want parsed raw logs in our database from local raw logs. Since they follow the same DataStruct format, I created a cloud runner that schedules parsing and SQL batch insertion daily using logs uploaded from our systems in S3.
The runner retrieves unprocessed logs from S3, extracts them, and does a CopyFrom to bulk insert them into the database.
Here's a diagram of the data flow:

Alerts
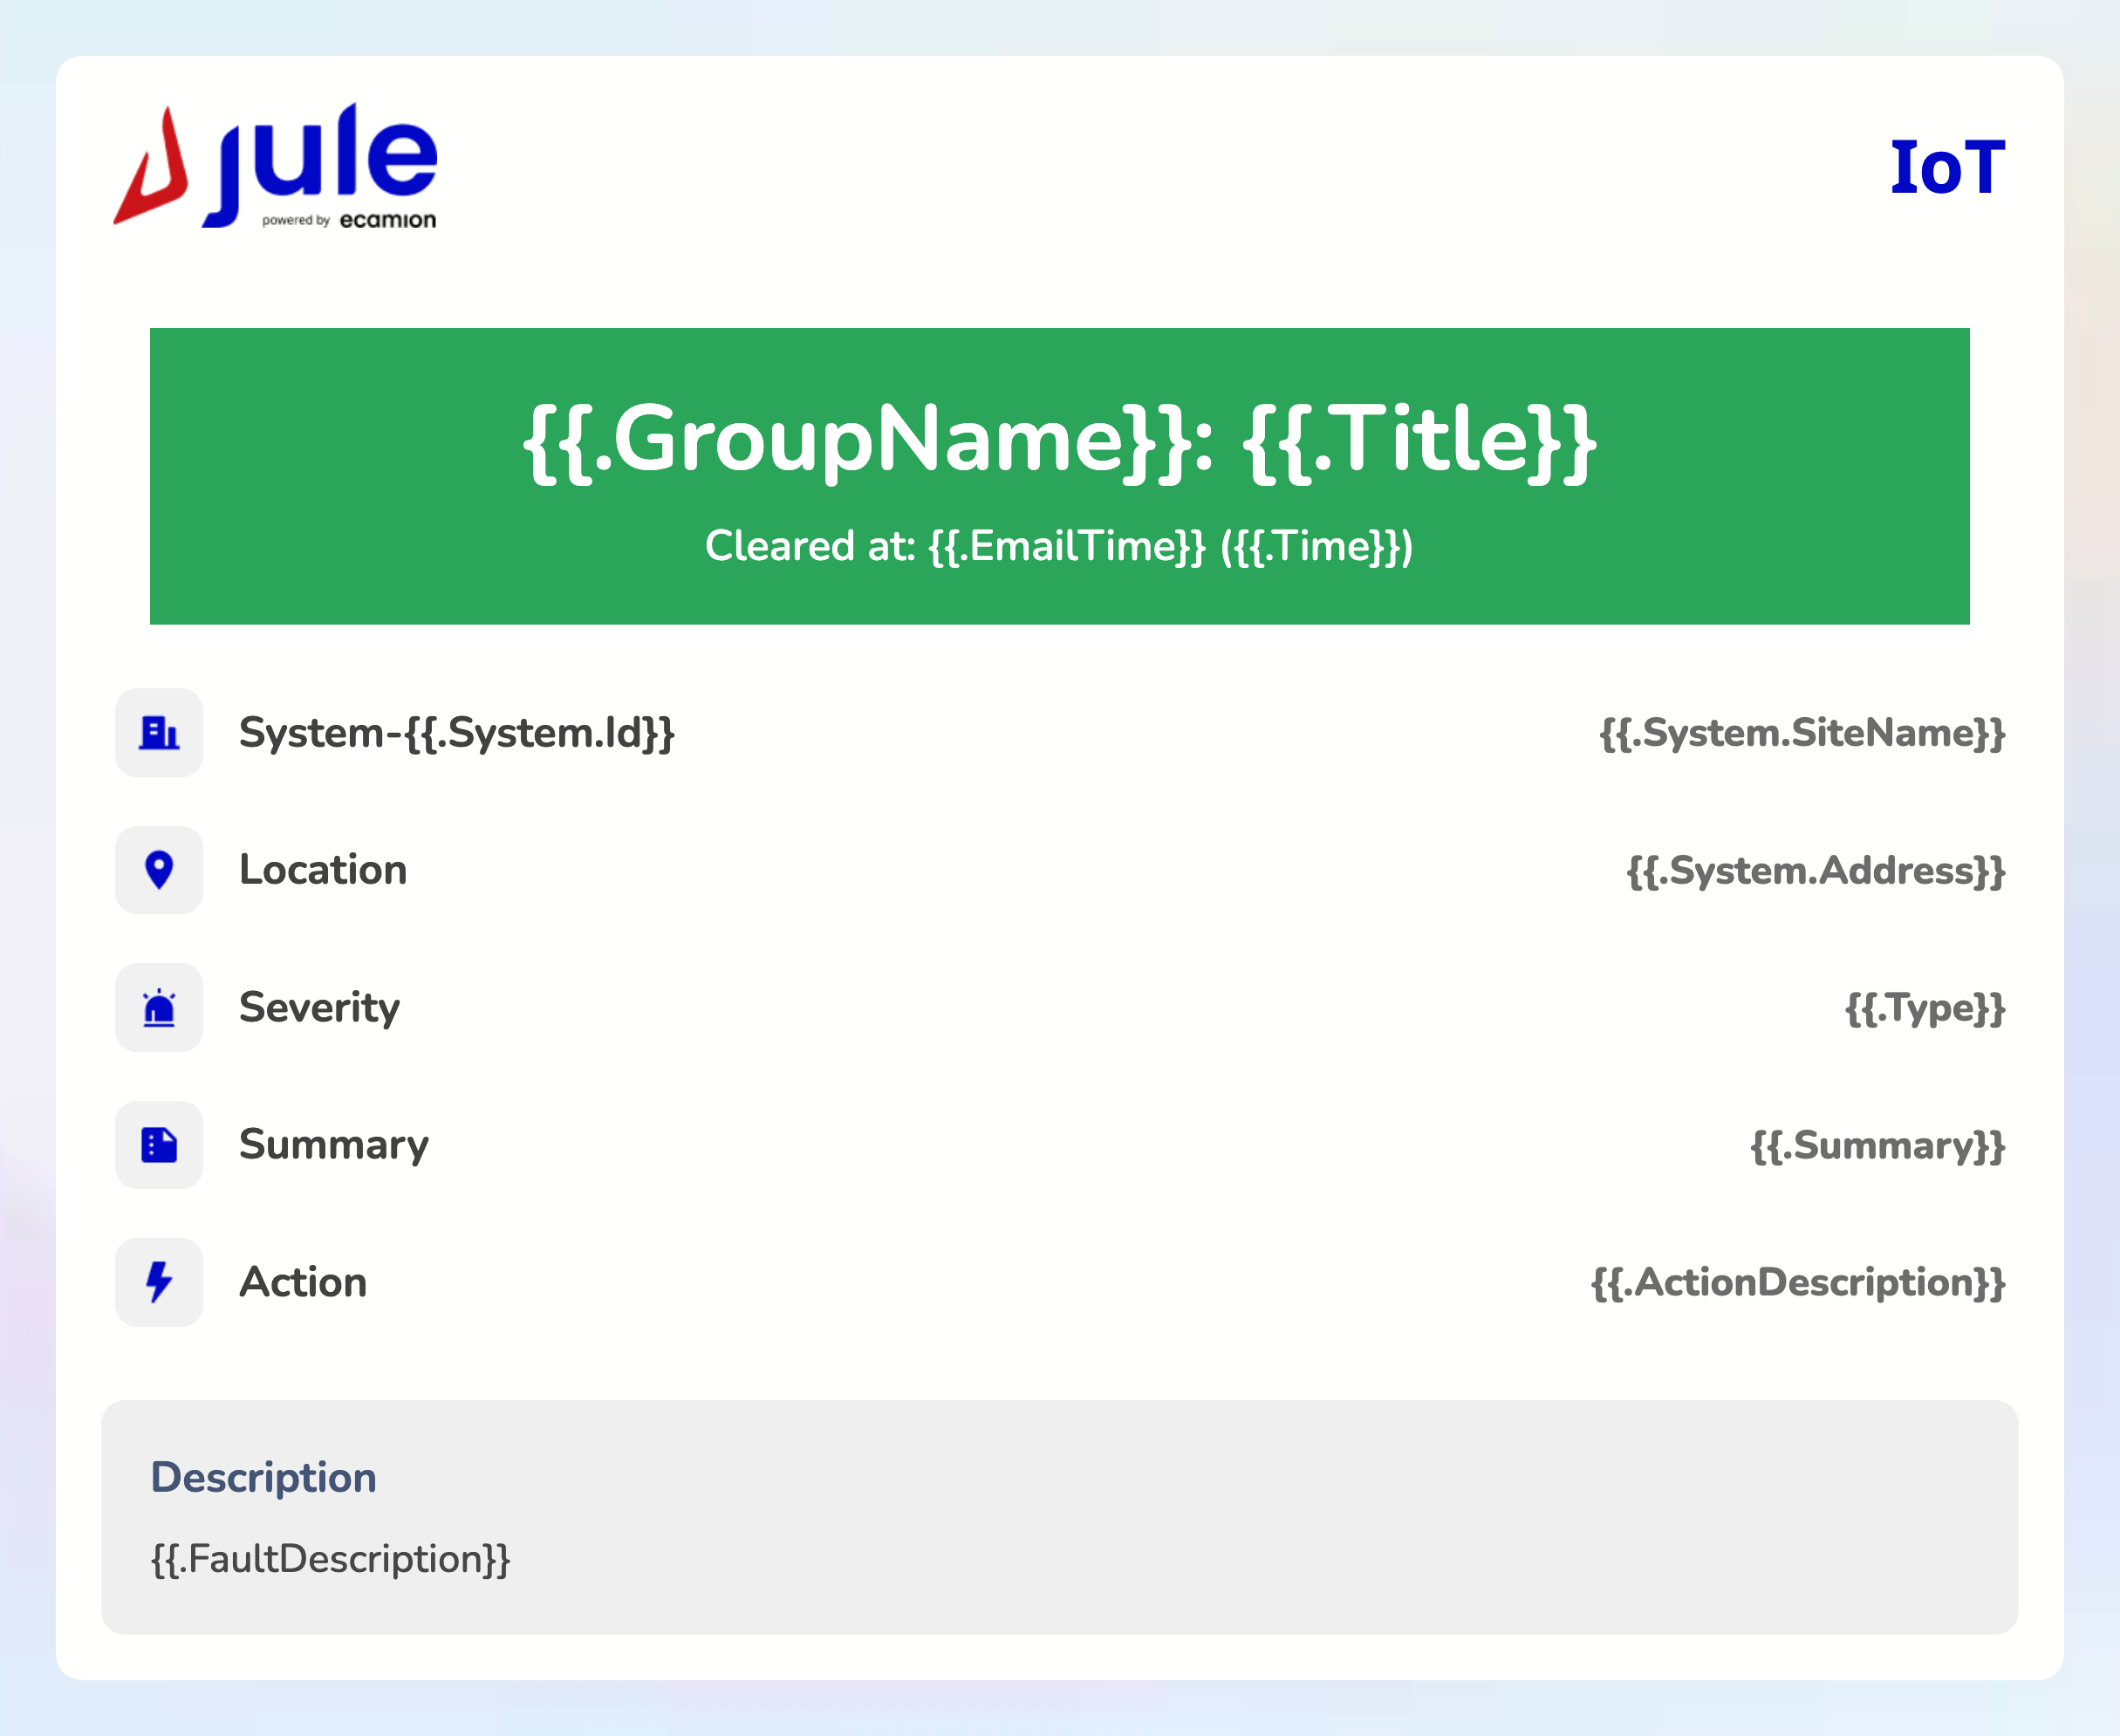

Our goal is to notify our engineers, customer service representatives, and our customers whenever any component goes wrong.
This can be through Slack or Email or Our platform. Alerts are required to be processed in real-time.
- System: As mentioned in our
Local Data Pipeline, alerts are first triggered by our generic parser and dynamic processors. Using a pre-configured alert table and alert ids, I first publish alerts from systems. This gets published on a special alert topic on MQTT:
For instance, to report whenever ESSState becomes 0 or 2 and clear the alert, we can use the following using our dynamic processor:
func (e *ESS) alertsGen(dataStruct DataStruct, spec DataSpec, deviceConfig config.DeviceConfig, currentAlerts AlertMap) AlertMap {
	fields := map[string]interface{}{
		"ess_state": e.ESSState,
	}
    // We report all fields and values that cause the alert together with the alert in the payload
	groupName := spec.GetGroupName()
	switch e.ESSState {
	case 0:
		currentAlerts.Add(groupName, fields, ESSStateIs0)
    case 2:
		currentAlerts.Add(groupName, fields, ESSStateIs2)
	default:
		currentAlerts.Clear(groupName, fields, ESSStateIs0, ESSStateIs2)
	}
    return currentAlerts
}
Our parser invokes alertsGen() on every data segment and publishes clear or trigger alert records to MQTT.
Our parser treats alerts like any other component data but groups all alerts in a special group. All five layers of cloud streaming procedures are triggered on the creation or deletion of any alert under the component and system.
This means that backend and frontend developers can treat real-time alerts in a similar manner without losing any information. Alerts are stored in the database, Redis, IoT shadow, and S3. They can be consumed by subscribing to wildcard topics in IoT Shadow and Redis.
Notifications
We wanted alerts to be sent to Slack and Emails. This was done using two additional lambdas. Slack notification uses slack bots and message blocks. Email is rendered using HTML templates. Notifications use preconfigured receivers in the database to check which alert IDs should be sent and to whom it should be sent.
If it is a system condition, fields and actions are sent with condition descriptions to technicians.
Slack Modals
In addition to passive notifications on system conditions, I created real-time modals in Slack. Our team members can check the system status attached to a notification message directly without needing to access any of our frontend.
This requires an additional endpoint in our backend services. Slack would invoke the endpoint with ActionCallback to retrieve the modal information or the dropdown menu. The backend handles the interaction using parameters passed along.


Lambda MemCache
Sometimes, we want to attach additional information to the message returned from a cloud lambda. For instance, we want the system information (system name, pictures, owner), alert table (alert severity, solution, description, summary) to be attached to an email we’re sending.
Even though I only open the database or redis connection once and keep it alive in our lambda runners, it can still be expensive when data is coming in frequently and any lambda requires such metadata. We don't want to fetch from a database every time a notification happens.
I decided to cache any metadata in memory using a simple mechanism:
package memcache

type Cache[T any] struct {
	Data        T
	LastFetched time.Time
	TTL         time.Duration
	FetchMethod func() (T, error)
	mutex       sync.Mutex
}

// returns the cached data if it is not expired, otherwise fetches new data and returns it
func (c *Cache[T]) Get() (T, error) {
	c.mutex.Lock()
	defer c.mutex.Unlock()
	// if the cache is empty, fetch new data
	if c.LastFetched.Add(c.TTL).Before(time.Now()) {
		log.Info("Cache expired, fetching new data")
		data, err := c.FetchMethod()
		if err != nil {
			return c.Data, err
		}
		c.Data = data
		c.LastFetched = time.Now()
	}
	return c.Data, nil
}

// takes an expiration time and a function that returns the data to be cached and returns a Cache object
func CreateCache[T any](ttl time.Duration, fetchMethod func() (T, error)) *Cache[T] {
	cache := &Cache[T]{
		TTL:         ttl,
		FetchMethod: fetchMethod,
	}
	return cache
}

// example cache for system info
var SystemsCache = CreateCache[systemsMap](2*time.Hour,
	func() (systemsMap, error) {
		var systems []*SystemDB
		err := sqlmgr.GetDB().Scan(&systems,
			`SQL...`)
		if err != nil {
			log.Errorf("error getting systems: %v", err)
			return nil, err
		}
		systemsMap := make(systemsMap)
		for _, v := range systems {
			systemsMap[v.Id] = *v
		}
		return systemsMap, nil
	},
)
This way, I only need to CreateCache() once using structs. Every time I require data, I call memcache.CacheName.Get(), which either returns an in-memory struct or refetches if it has expired.
User Interaction
We have our historical data in TimescaleDB and real-time updates from MQTT or Redis. The task remaining is to stream this to the user.
I originally thought of either using Websocket or a library that implements Websocket like Socket.IO. I found that we didn't need real-time incoming publishes originating from the user. All our real-time communication originates from the cloud side. User requests can be implemented using REST APIs efficiently.
Backend implementation of SSE is straightforward as it only involves forwarding filtered messages to the corresponding SSE event streams. I used this SSE library in Go.
useSSE()
As our frontend is mostly written in React, I decided to implement a base use hook for SSE event sources to manage its life cycles. A handler callback is passed to it to receive events, so developers can choose to store the component states in a local or global store:
export interface EventHandler {
    event: string,
    handler: (event: any) => void
}

interface EventSourceBundle {
    eventSource: EventSource,
    subscribers: number
}

const eventSources = new Map<string, EventSourceBundle>()

function newEventSource(queryKey: string[], url: string,
                        ...handlers: EventHandler[]) {
    const key = queryKeyToString(queryKey)
    const events = handlers.map(h => h.event)
    if (!eventSources.has(key)) {
        const eventSource = new EventSource(url, {withCredentials: true})
        handlers.forEach((handler) => {
            eventSource.addEventListener(handler.event, handler.handler)
        })
        eventSources.set(key, {
            eventSource: eventSource,
            subscribers: 1
        })
    } else {
        const bundle = eventSources.get(key)
        if (bundle) {
            bundle.subscribers++
        }
    }
    return eventSources.get(key)
}

function destroyEventSource(queryKey: string[]) {
    const key = queryKeyToString(queryKey)
    if (eventSources.has(key)) {
        const bundle = eventSources.get(key)!
        bundle.subscribers--
        if (bundle.subscribers <= 0) {
            console.debug("destroy event source", key)
            bundle.eventSource.close()
            eventSources.delete(key)
        }
    }
}


export function useSSE(enable: boolean, queryKey: string[], url: string, dependencies: DependencyList, ...handlers: EventHandler[]) {
    useEffect(() => {
        if (enable) {
            newEventSource(queryKey, url, ...handlers)
        }
        return () => {
            destroyEventSource(queryKey)
        }
        // eslint-disable-next-line react-hooks/exhaustive-deps
    }, [...dependencies, enable])
}
This hook makes sure we are reusing existing event sources if they target the same event stream. We can utilize this to call useSSE() or its wrapper functions in multiple components without creating multiple connections.
To easily integrate real-time component/system status into any component, I created other hooks based on useSSE() in a separate library. They utilize the latest state of components together with the real-time updates from SSE.
Metrics
To abstract away specific metric endpoints and requirements, I designed the following Spec for metrics retrieval:
Metric struct {
		Field        *string `json:"field"`
		Group        *string `json:"group" validate:"required"`
		Start        *int64  `json:"start"`
		End          *int64  `json:"end"`
		SystemId     *int32  `json:"system" validate:"required"`
		Source       string  `json:"source"` // validated by source map
		Limit        *int    `json:"limit"`
		Precision    string  `json:"precision"` // validated by precision map
		Aggregate    string  `json:"aggregate"` // validated by aggregate function map
		TimeZone     string  `json:"timezone"`
		isJsonMetric bool
	}

MetricsSQLBuilder struct {
		Field           string
		Conditions      []string `delimiter:" "`
		Selects         []string `delimiter:","`
		LimitClause     string
		Limit           int
		GroupBy         string
		Schema          string
		Table           string
		Repeat          int
		Source          string
		TimestampColumn string
	}
To avoid SQL injection but also enable dynamic SQL query building, I used the library's SQL parameter parsing. On top of that, if a query requires non-value input from users (e.g., appending aggregate functions or changing data precision to be used by the bucket), the builder only accepts a range of values or regex.
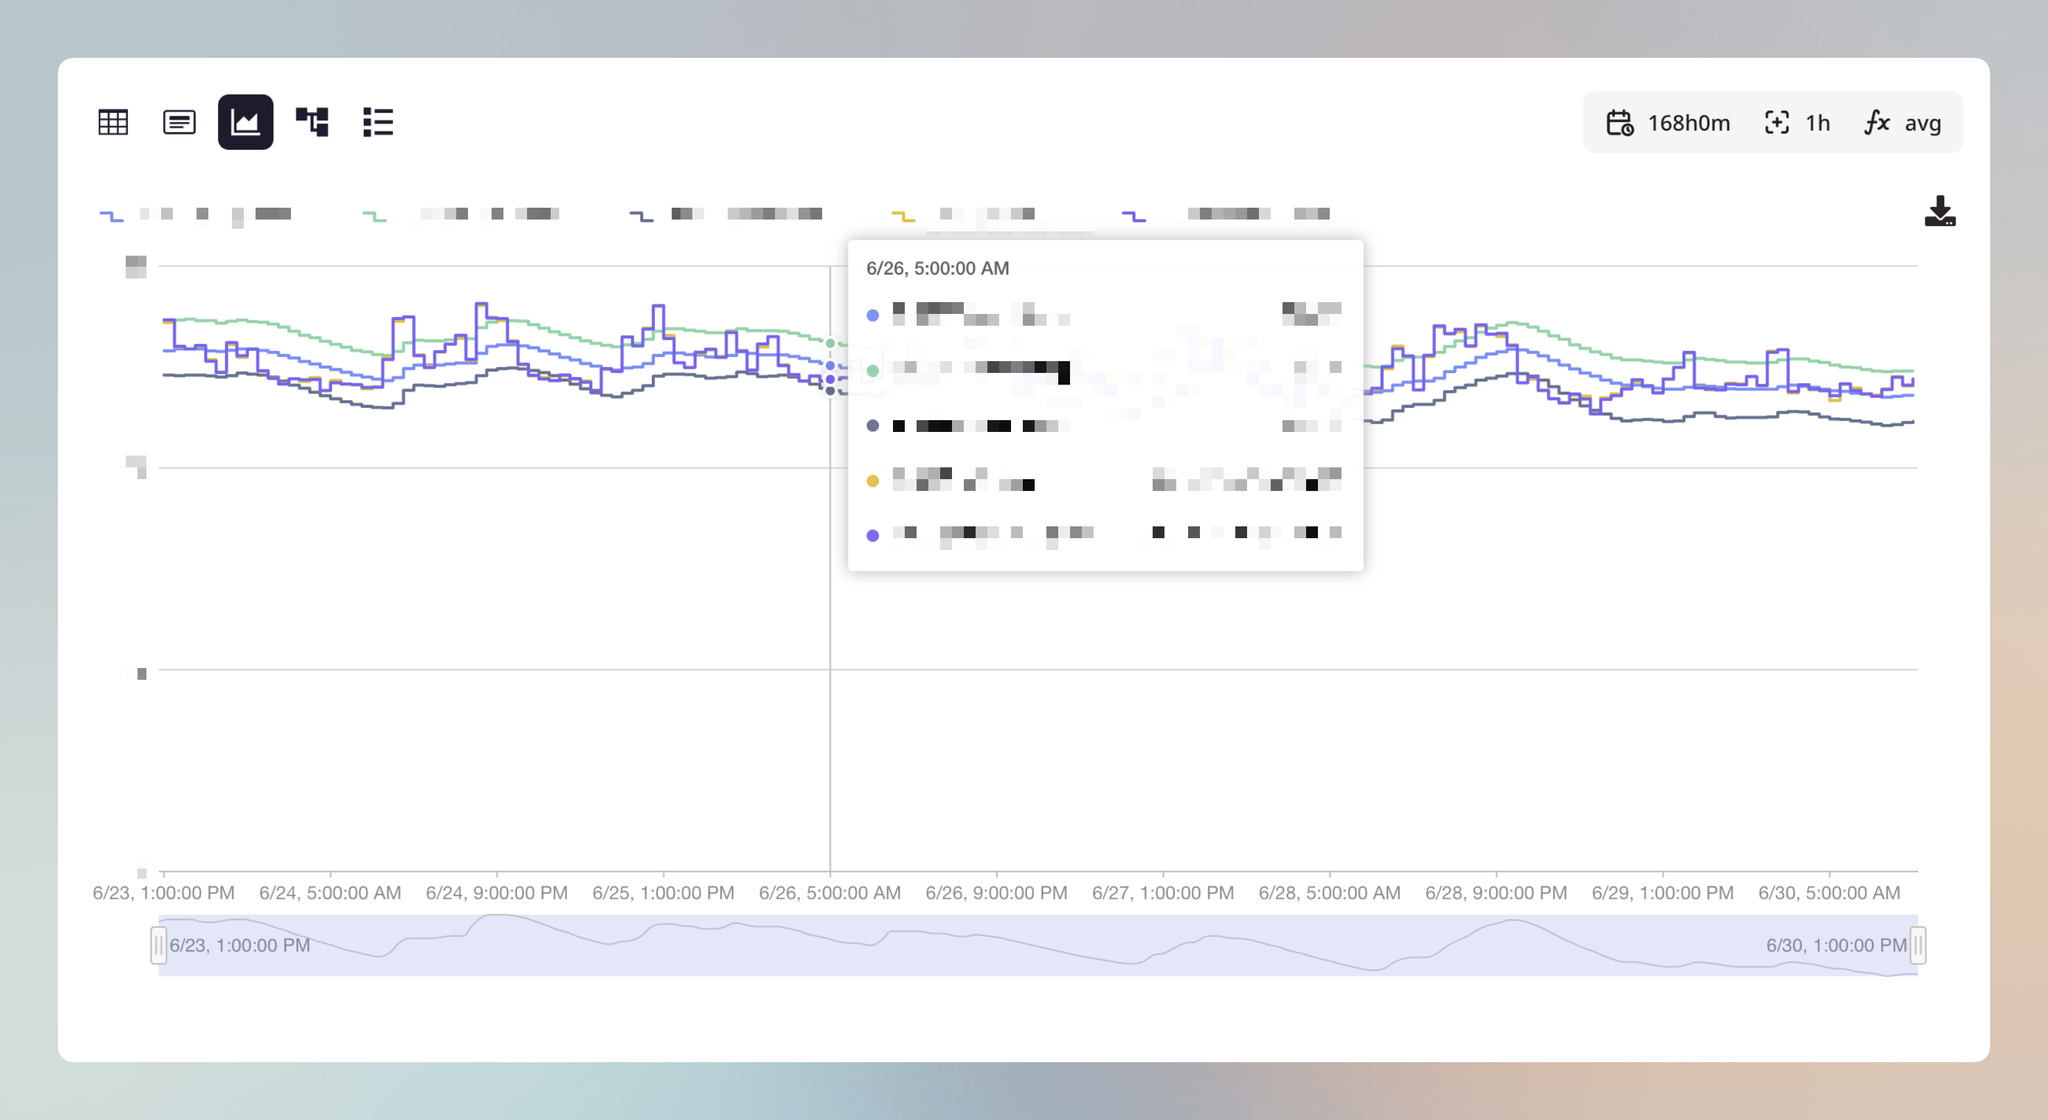
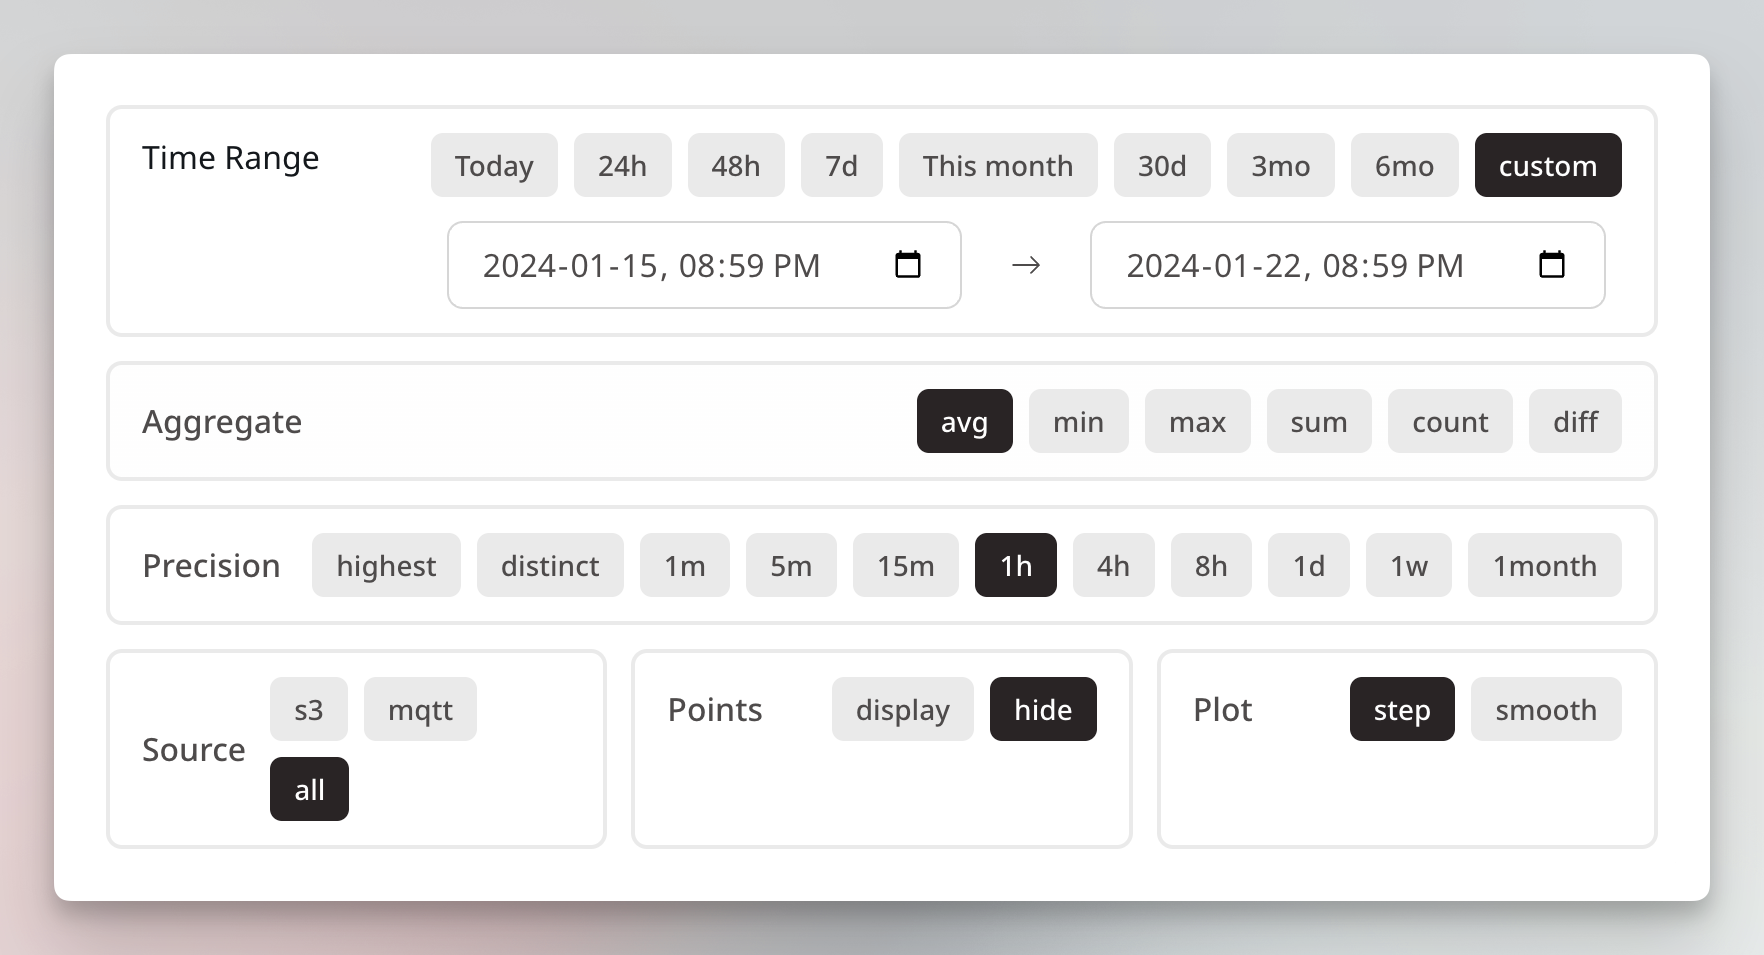
This way, I was able to define many presets and allow our developers to create custom filters directly on the website to group metrics by any components and systems and apply functions directly on them:


Commands (Bidirectional Request and Response)
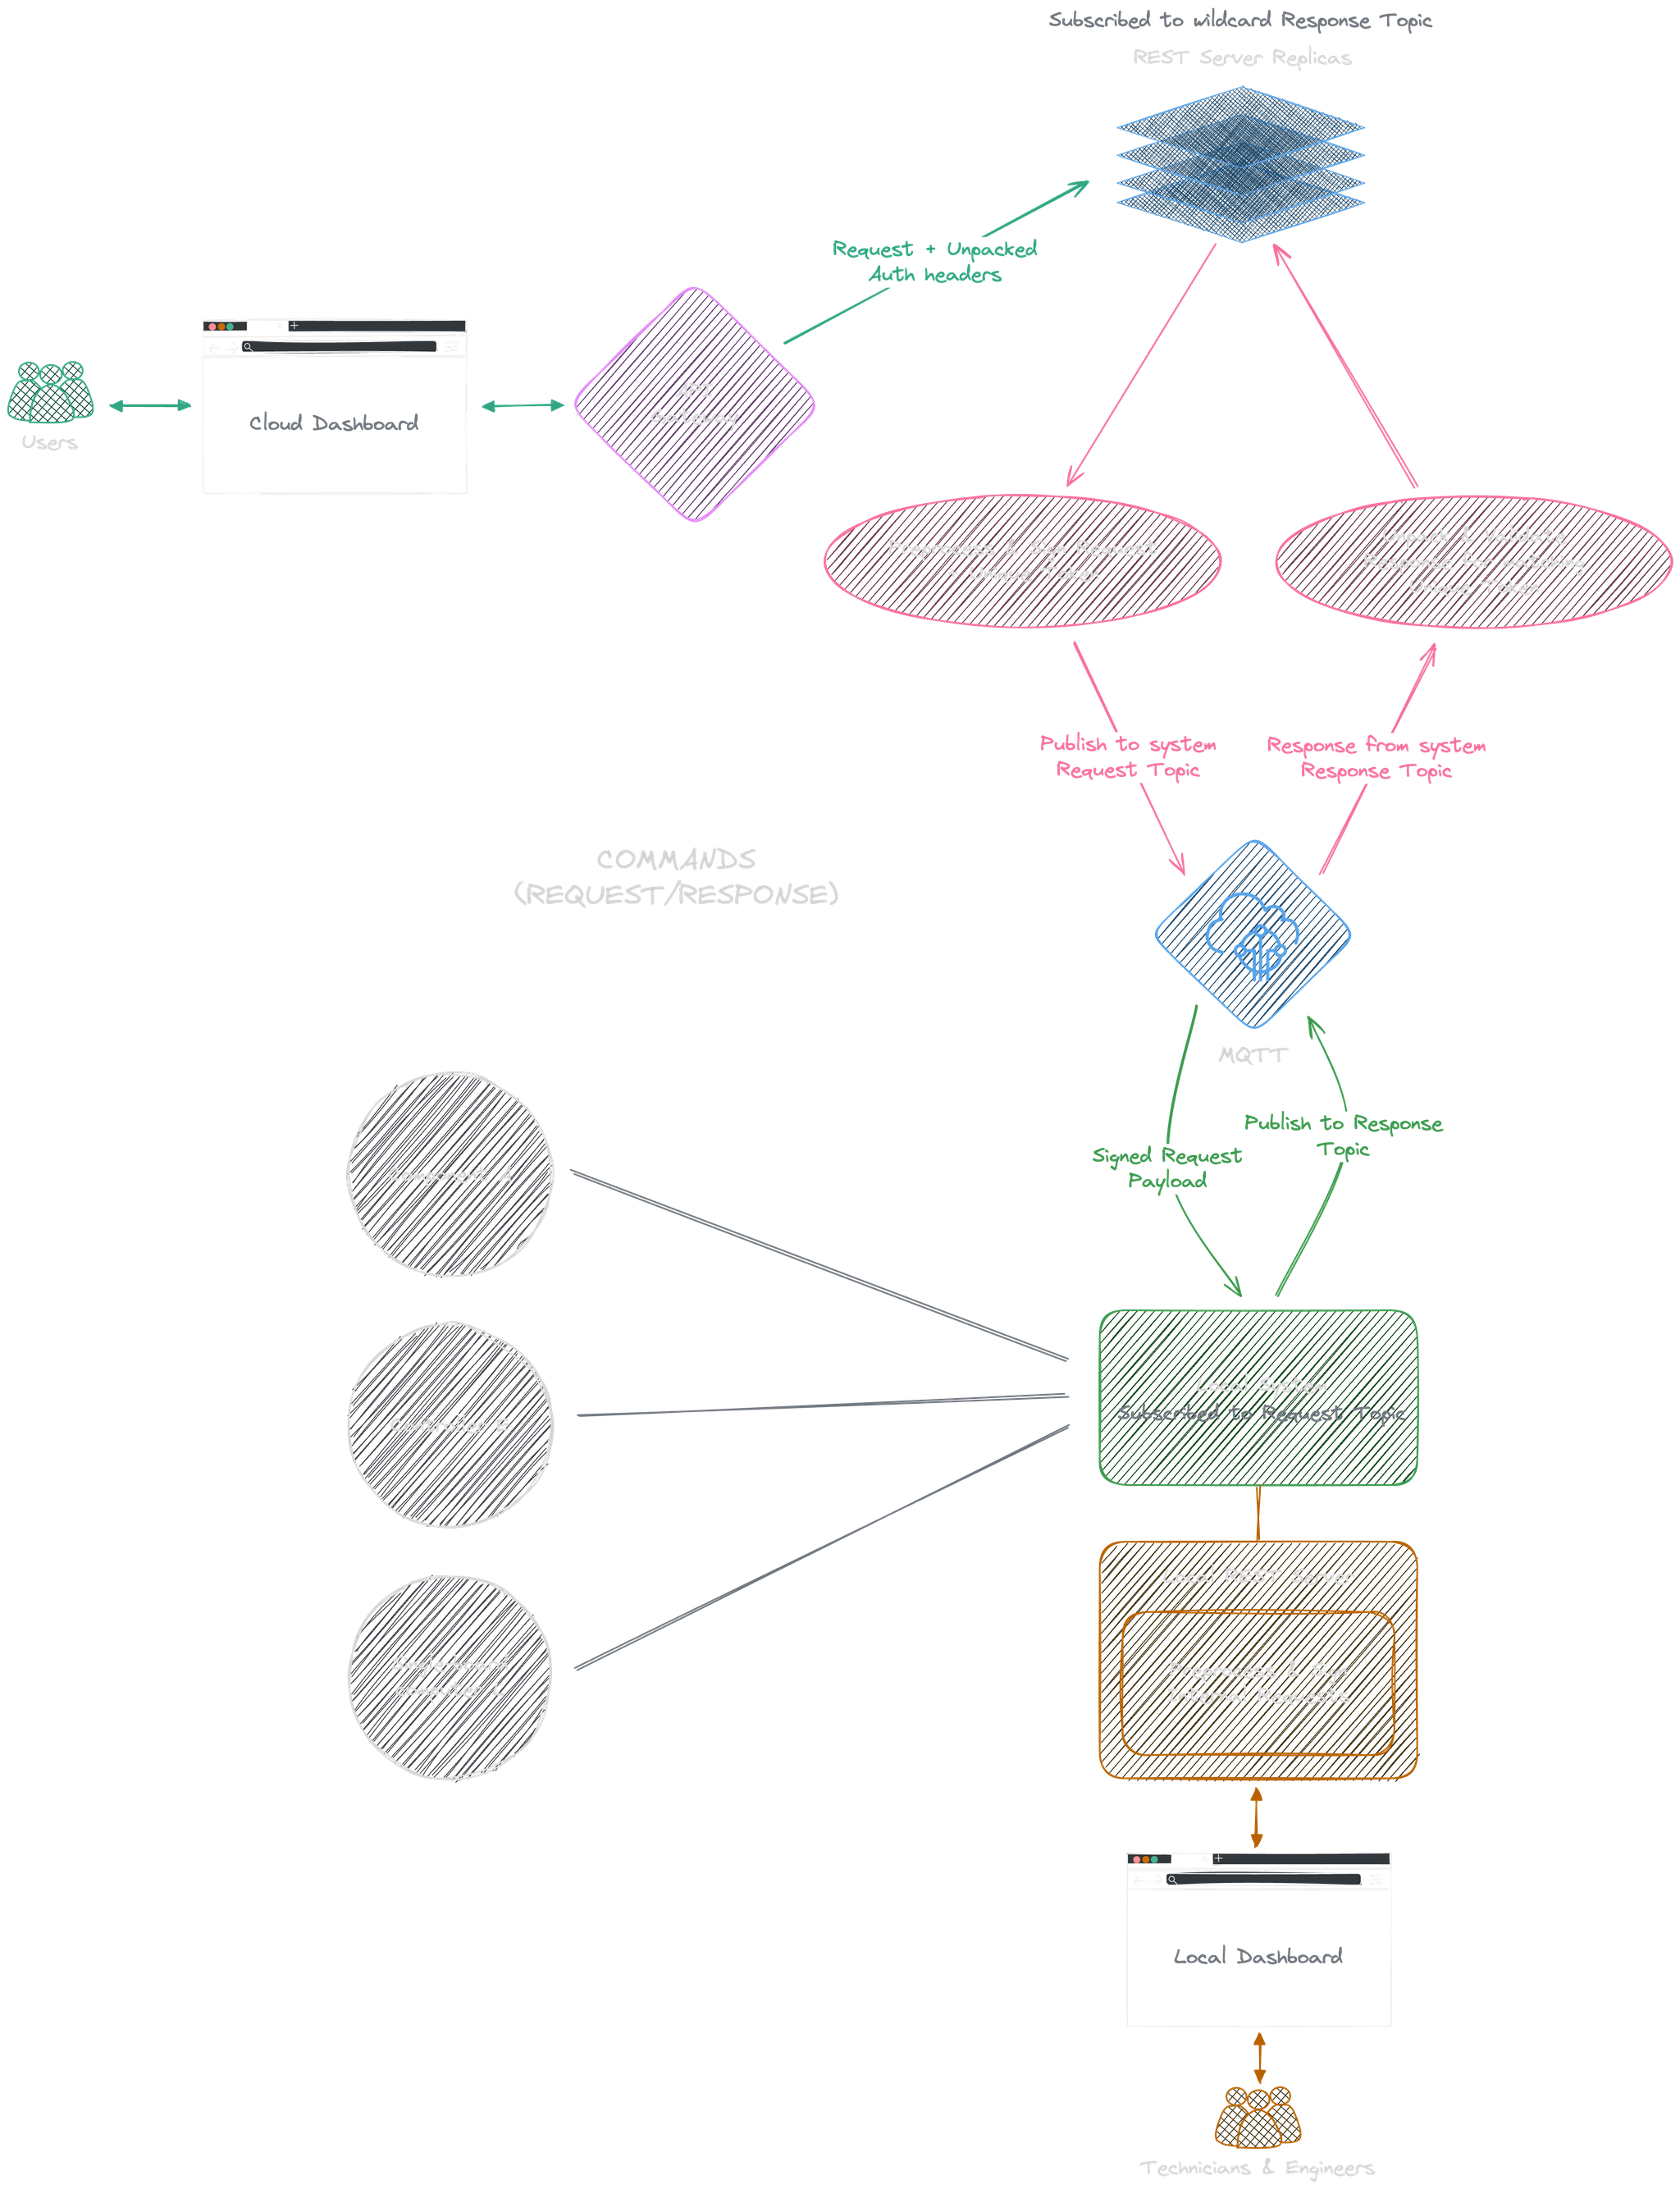
Our goal is to integrate a framework into our REST backend that interacts with our systems using MQTT. I found it easier to make this backend share the same code as the local schedulers.
- When a request hits the backend on
/:system/path(refer to Auth and SSO setup), it checks the JWT for the matching permissions. - If the user is authorized, backend first processes the request in its own routine to produce a parsed internal request for systems to consume.
- Cloud servers then publish the job in a signed packet on the matching topic to which the system is subscribed.
- Local systems verify the requests and run a handle function to process it; then a response is returned to a response topic under the request ID and system.
- Cloud servers are subscribed to a wildcard of response topics and keep a local copy of all request tokens initiated from the current instance. Once a request is received, it checks if the token matches existing ones, parses the response, and returns the final response to the user.
Local Go schedulers handle all incoming requests based on the job payload, which may include:
- Time: Appending issue and completion time for the action
- Blocking: If it should lock the second request of the same type when the first one is running
- TimeBetweenRequests: The time gap a second request can be processed after the first one. StatusTooManyRequests is returned from the system if the request doesn't follow it.
Developers only need to implement the endpoint, its permissions and configurations, and the actions on cloud servers and on local systems. For instance, a request to get a list of local Docker containers:
var ActionMapping = mapping{
    "docker/ls/containers": {
		http.MethodGet: {
			httpRequest:     &DockerListContainerHTTPRequest{},
			internalRequest: &DockerListContainerHTTPRequest{},
			Permission:      ViewInternalSystemStatus,
			Blocking:        false,
			ServerTimeout:   time.Duration(10) * time.Minute,
			TimeBetweenRequests: time.Duration(10) * time.Second,
		},
	},
}
type (
DockerListContainerHTTPRequest struct {
Host string `query:"host"`
BaseHTTPRequest
}
)
/*
This function runs on REST servers, where it first produces an internal request for the system
*/
func (r *DockerListContainerHTTPRequest) GetInternalRequest(_ echo.Context) (InternalRequest, *echo.HTTPError) {
return r, nil
}
/*
This function runs on the system, it receives the request with the action tokens and returns a response
*/
func (r *DockerListContainerHTTPRequest) Handle(jobRequest *ActionRequest) (interface{}, int) {
client, _ := dockermgr.GetDocker(r.Host)
if client == nil {
return "docker client not initialized", http.StatusInternalServerError
}
containers, err := client.ContainerList(context.Background(), types.ContainerListOptions{})
if err != nil {
return err.Error(), http.StatusInternalServerError
}
return containers, http.StatusOK
}Developers also have access to Modbus services for synchronized register writing in these actions
Requests directed at other local services in the LAN can be issued from here
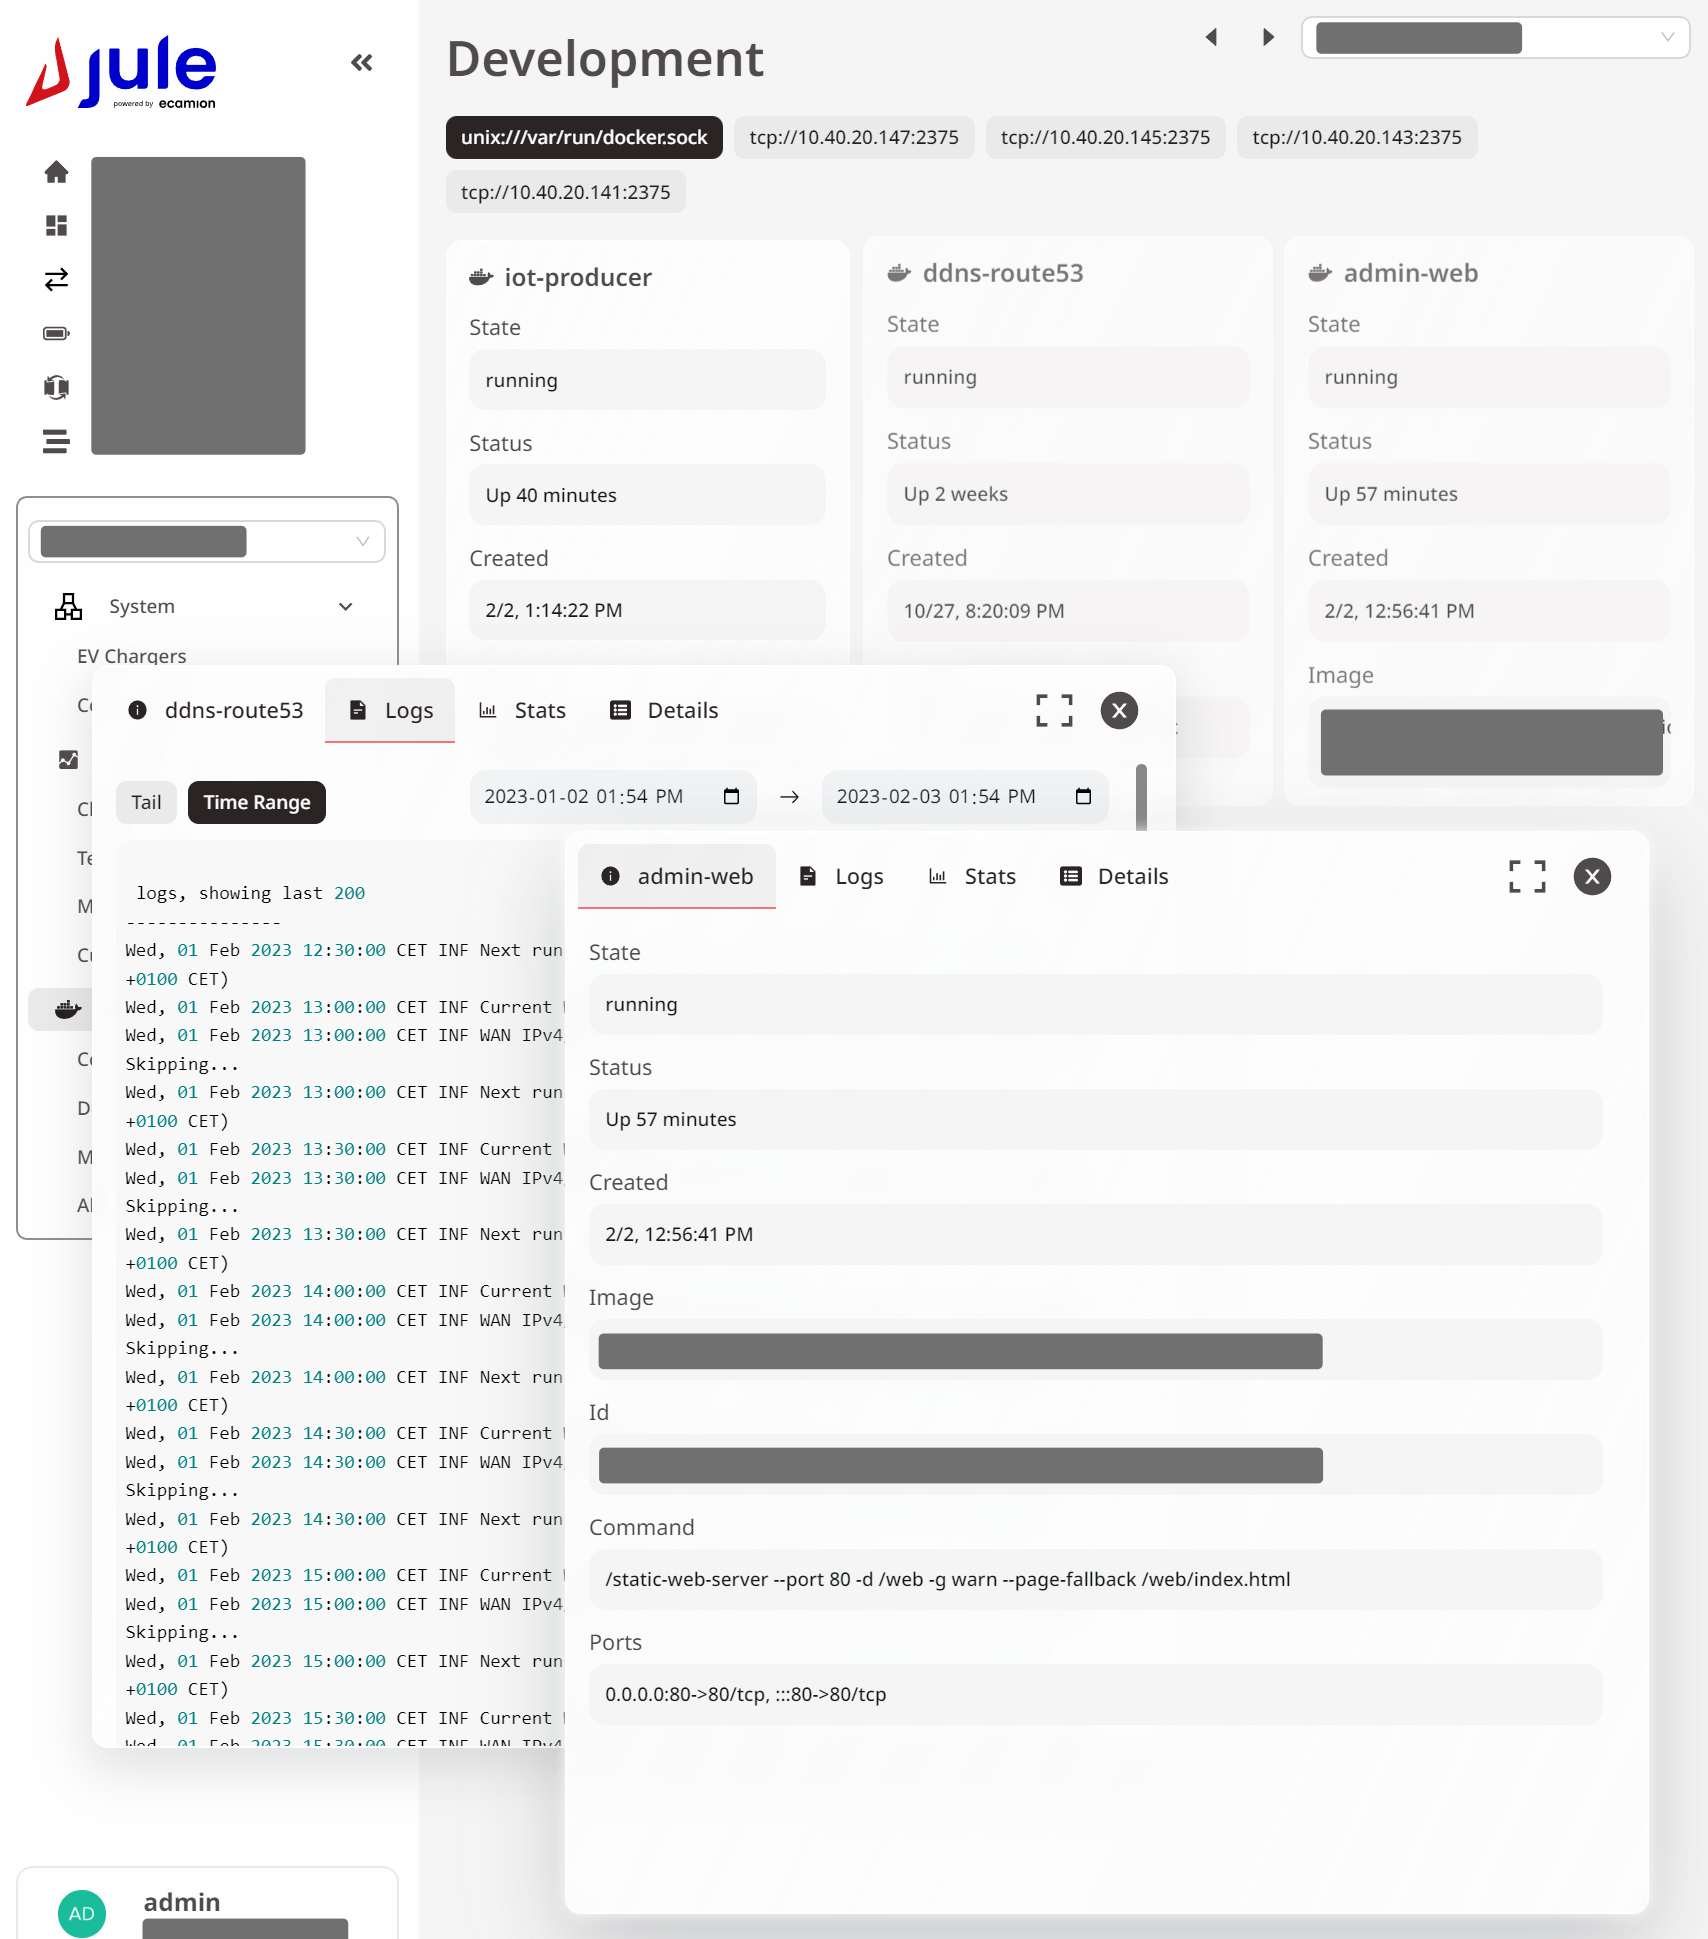
Docker Dashboard

Local Commands
I implemented a similar local REST API and a local dashboard. The only difference between this REST server and the cloud ones is that the requests, when they reach the local REST server from an internal IP:
- No authentication required
- Requests are handled locally directly by the local action funcs with a change of middleware (instead of needing to be signed and routed through MQTT)
Since cloud and local REST servers share the same code base, this enables all commands to be sent from both a local client and a remote one.
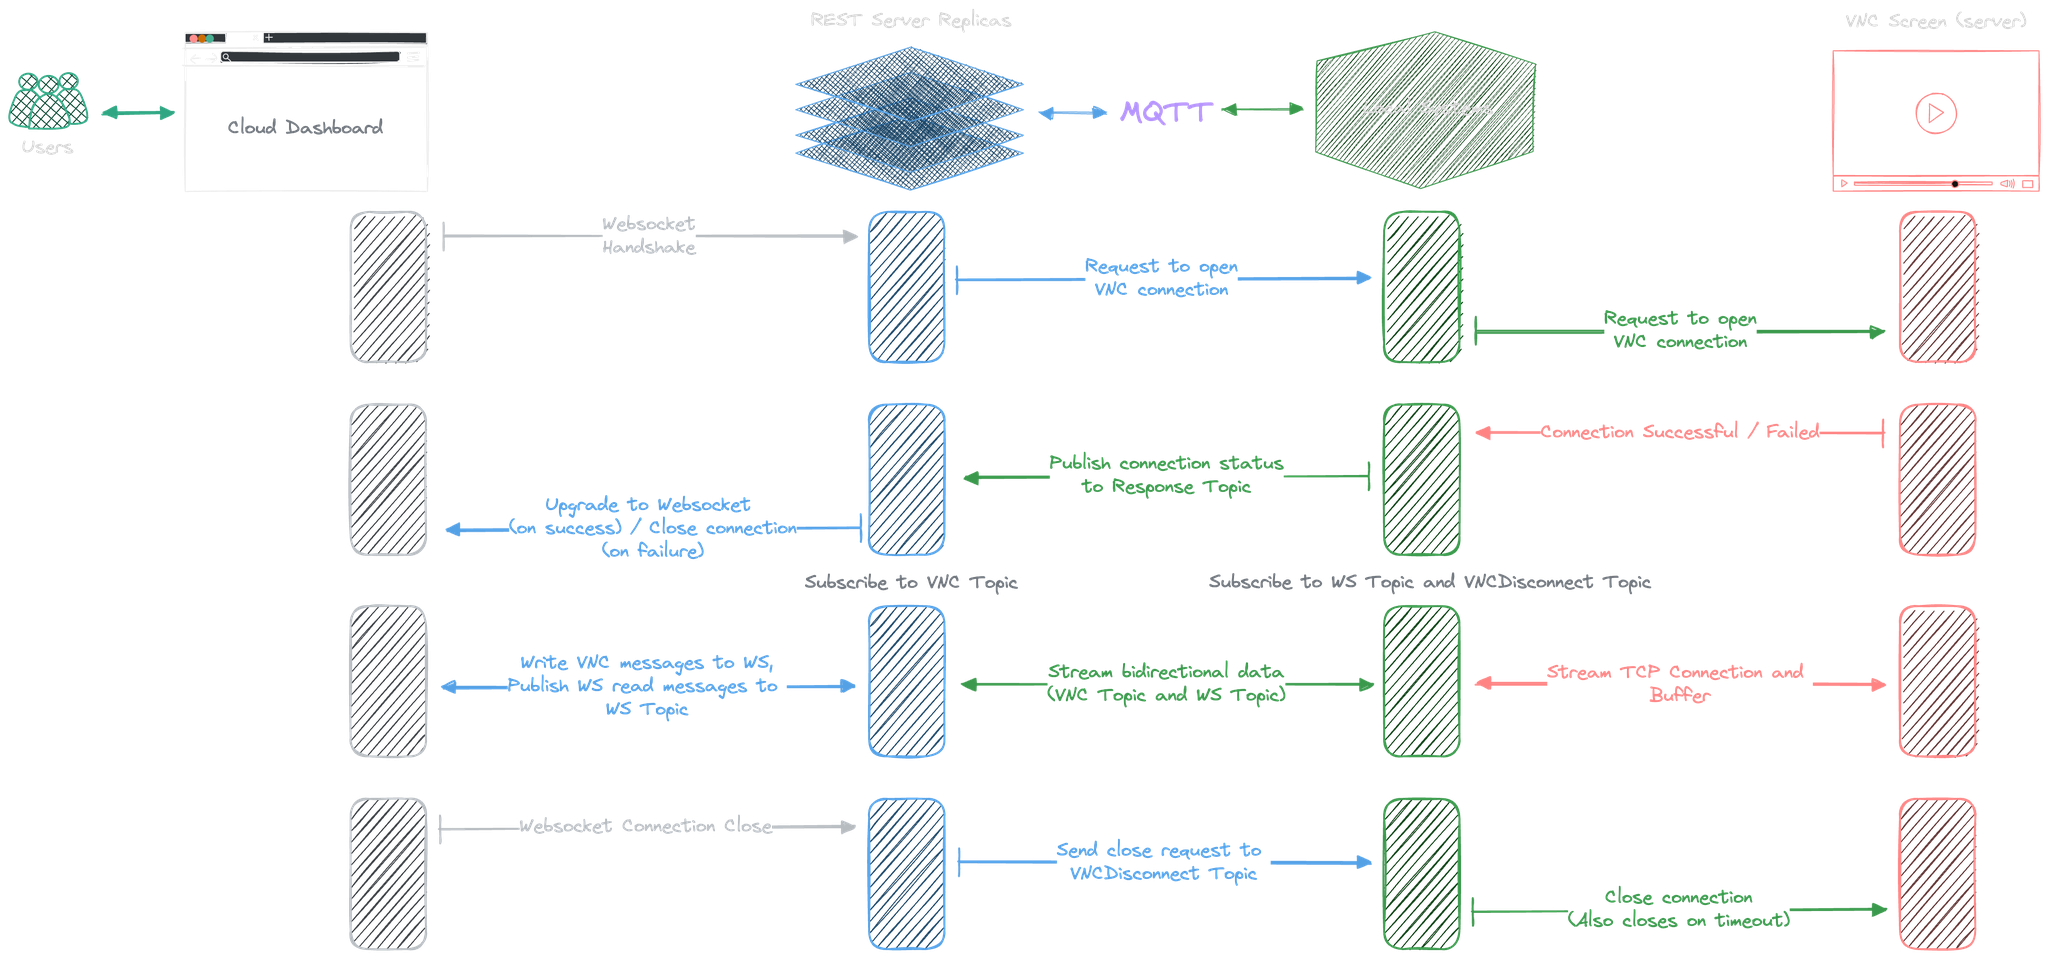
Flow Diagram

VNC on Web
This was quite a tricky requirement. Every charging station is equipped with a touch screen, which can be connected locally using VNC. We want to provide easy access to customer service members without requiring them to tunnel through our IoT setup. This requires a bidirectional tunnel.
Local System
I was able to implement this using the same command model using MQTT, WS, and TCP proxy.
When the command hits the system,
the system first tries to open a TCP connection to the target VNC server
and streams the buf to a separate MQTT topic under the VNC destination and system ID. After which,
it subscribes to a VNC topic for incoming interactions and forwards it to the TCP stream
(i.e., by writing it to the connection).
Cloud
The cloud backend will first receive an OK response if the connection is successful. It then upgrades the connection to Websocket with ws.PayloadType = websocket.BinaryFrame. Cloud then forwards the raw data in the VNC publishing stream to the user with Websocket and forwards the user publishing data back to a VNC topic to which the local system is subscribed.
Disconnection
Disconnection is handled by an additional vnc-disconnect topic. Local system subscribes to this topic on successful connection, and backend publishes to it when the user's Websocket connection is closed. An additional timeout is specified for this on the local system.

func (b *BufCopy) Stream(src io.Reader, topic string) (written int64, err error) {
	buf := b.Get().([]byte)
	defer b.Put(buf)
	for {
		nr, er := src.Read(buf)
		if nr > 0 {
			mqtt.Publish(topic, buf[0:nr]).Wait()
			written += int64(nr)
		}
		if er == io.EOF {
			break
		}
		if er != nil {
			err = er
			break
		}
	}
	log.Warnf("Stream end %s", topic)
	return
}

func Stream(i io.Reader, topic string) error {
	_, err := bcopy.Stream(i, topic)
	if err != nil {
		return err
	}
	return nil
}

func (r *VNCHTTPRequest) Handle(jobRequest *ActionRequest) (interface{}, int) {
    // p is a custom proxy struct that wraps around all the data and convenient methods
	address := fmt.Sprintf("%s:%s", c.IP, c.Port)
	p := newProxy(jobRequest.Token, address)
	err := p.connect()
	if err != nil {
		return "unable to connect to " + address, http.StatusInternalServerError
	}
	go func() {
		p.stream()
		p.subscribe()
	}()
	go func() {
		time.Sleep(time.Duration(config.VNCTimeoutSeconds) * time.Second)
		removeProxy(jobRequest.Token)
	}()
	return nil, http.StatusOK
}
The frontend part can be handled by a VNC library.
I used react-vnc for this.
url is the websocket url to our cloud server,
where the server handles the proxy establishment with the local system on handshake
before upgrading the user to websocket:
import { VncScreen } from "react-vnc";
<VncScreen
  url={url}
  scaleViewport
  background="white"
  ref={vncScreenRef}
/>
Docker Management Backend
Now that our request can be parsed by cloud servers and processed on local systems. We can directly stream Docker management requests with this.
I could've used existing tools like Portainer, but I found that they used too much data, and it's hard to integrate it into our own platform for easier access.
Docker already provided comprehensive SDKs in Go. I only need to interact with it and configure it for all our local services once before having access to full-fledged container management requests. This integrates easily into our authorization and action models:
Local unix socket: unix:///var/run/docker.sock{
"dockerHosts": {
"Id1": {
Address: "tcp://ip:2375",
}
}
}Docker TCP socket needs to be enabled on SBCs running other services. Our framework maintains a list of preconfigured Docker clients.
We've already covered how to get a list of containers using the SDK. Here's an example of how to get container logs; the documentation is straightforward, and source code of the library can be navigated:
client.ContainerLogs(context.Background(), containerName, options)I'm going to ignore most of the implementation except one special case: Upgrading or downgrading the service where this docker management container lives.
Changing the image tag of the management container itself
Normally, when we upgrade or downgrade (i.e., change the tags of image) a container, a new image is pulled (if the matching tag doesn't already exist on the system). We then stop the old container and create a new one using the exact same configuration as the old container.
This process of recreating a container is required as Docker doesn't provide SDK functionality for in-place image replacement. This is similar to how Watchtower handles container base image updates.
However, we can't recreate the management container once we destroy itself. We can only create a new one, stop all functionalities in the old one (potentially with a global toggle), and let the new container destroy the old one on startup and manage the cleanup. I implemented it this way and labeled the management container so it could be identified by itself. It worked without issues (except that temporarily, we get to see two containers of the same image running).


Tags:
Lambda,
Docker,
S3,
Redis,
TimescaleDB,
MQTT,
Go,
System Design

